. 2006 Jun;26(12):4564-76.
doi: 10.1128/MCB.00266-06.

p18 Ink4c and Pten constrain a positive regulatory loop between cell growth and cell cycle control

Affiliations

p18 Ink4c and Pten constrain a positive regulatory loop between cell growth and cell cycle control

Feng Bai et al. Mol Cell Biol. 2006 Jun.

Abstract

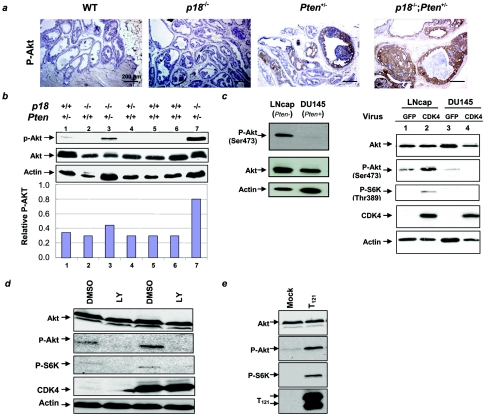
Inactivation of the Rb-mediated G1 control pathway is a common event found in many types of human tumors. To test how the Rb pathway interacts with other pathways in tumor suppression, we characterized mice with mutations in both the cyclin-dependent kinase (CDK) inhibitor p18 Ink4c and the lipid phosphatase Pten, which regulates cell growth. The double mutant mice develop a wider spectrum of tumors, including prostate cancer in the anterior and dorsolateral lobes, with nearly complete penetrance and at an accelerated rate. The remaining wild-type allele of Pten was lost at a high frequency in Pten+/- cells but not in p18+/- Pten+/- or p18-/- Pten+/- prostate tumor cells, nor in other Pten+/- tumor cells, suggesting a tissue- and genetic background-dependent haploinsufficiency of Pten in tumor suppression. p18 deletion, CDK4 overexpression, or oncoviral inactivation of Rb family proteins caused activation of Akt/PKB that was recessive to the reduction of PTEN activity. We suggest that p18 and Pten cooperate in tumor suppression by constraining a positive regulatory loop between cell growth and cell cycle control pathways.


Figures

FIG. 1.
FIG. 1.
Survival and lymphadenopathy of p18 and Pten mice. (a) The graph summarizes the viability of mice with each genotype. The mean age of survival is given in Results. (b) Mice of different genotypes of the same litter at 6 months of age. Enlarged lymph nodes are indicated. (c) Gross appearance of lymph nodes from different mice at 6 months of age.
FIG. 2.
FIG. 2.
Collaboration between Pten and p18 in suppression of pituitary tumors. (a) Pituitary glands (arrows) from different genotypes of mice of the same litter were microscopically examined at 3.5 months of age either directly (top row) or after hematoxylin and eosin staining (bottom row). Anterior lobe (A), intermediate lobe (I), neurohypophysis (N), and a tumor (T) are indicated. (b) Pituitary tumorigenesis in different genotypes of mice late in life (after 9 months). The boxed area in the Pten+/ image is magnified in the inset. The arrow indicates the area of invasion from the anterior lobe into surrounding bone tissue. The lower right inset for p18/ Pten+/ shows the area of invasion from the intermediate lobe into the anterior lobe (arrow). The lower left inset for p18/ Pten+/ shows the anterior lobe tumor invading into the surrounding brain tissue (arrowhead). (c) Series of sections of pituitary glands from mice of different genotypes at 9 months of age were examined for mitotic activity by immunostaining with an antibody recognizing phosphorylated histone H3. Boxed areas are magnified in the insets (anterior lobe [lower left] and intermediate lobe [upper left]).
FIG. 3.
FIG. 3.
Collaboration between Pten and p18 in suppression of thyroid and adrenal tumors. (a) Hematoxylin and eosin staining of thyroids from mice of different genotypes at 3 months of age. Hyperplasia (H) and tumor (T) are indicated. (b) Thyroid tumors from mice of the same litter were examined at 9 months of age by hematoxylin and eosin staining and by immunostaining for calcitonin. Follicular cell adenoma (FA) and C-cell carcinoma (CC) are indicated. Calcitonin-containing tumor cell invasion is indicated by an arrow. (c) Immunostaining of the thyroid from wild-type (WT) and p18−/− mice (12 months of age) and of C-cell tumors from Pten+/− (12 months of age) and p18−/− Pten+/− (9 months of age) mice for phospho-Akt. (d) Gross appearance of adrenal glands from Pten+/− (10 months of age), p18−/− Pten+/− (9 months), and WT and p18/ (13 months) mice. (e) Hematoxylin and eosin staining of adrenal glands from different genotypes. Hyperplasia (H) and pheochromocytoma (T) of the adrenal medulla (AM) compressing the adrenal cortex (AC) are indicated. The arrow indicates the area of invasion from the medulla into the cortex. Note the intact medulla-cortex boundary in Pten+/− mice and disruption of the boundary in p18−/− Pten+/− mice.
FIG. 4.
FIG. 4.
p18 and Pten cooperate in prostate tumor suppression. (a) Gross appearances of age-matched wild-type (WT) and p18/ mice (12 months) are shown. Significant enlargement of the dorsolateral prostate (DLP) was seen. SV, seminal vesicle; BL, bladder. (b) Representative hematoxylin and eosin staining of prostates from mice of different genotypes at 6 months of age. Diagnostic criteria for PIN are described in the text. (c) Representative invasive adenocarcinoma from p18−/− Pten+/− prostates at 9.5 months of age. Nests of tumor cells invading into the stroma areas are indicated. (d) The high-grade PIN and carcinoma-free curve shows that reduction of the p18 gene significantly enhanced high-grade PIN and carcinoma susceptibility in Pten+/− mice. (e) Increase of cell proliferation in p18 Pten double mutant prostatic epithelium. Eight-week-old tumor-free prostates from mice of different genotypes were stained with antibody recognizing phosphorylated histone H3. Positive nuclei were counted in 10 randomly chosen fields.
FIG. 5.
FIG. 5.
Loss of the remaining wild-type Pten allele is tissue-specific and is protected by p18 loss. (a) Serial sections of prostate tumors from Pten+/ and p18/ Pten+/ mice were immunostained with activated Akt and PTEN. Note the strong p-Akt staining in the tumor (T) cells and very faint (negative) p-Akt staining in the normal (N) epithelium. In Pten+/ prostates, there is a mutually exclusive staining pattern between Pten and p-Akt expression in the tumor cells and normal epithelium. In p18/ Pten+/ prostates, most tumor cells retained Pten expression. (b) Presence of the wild-type Pten allele in prostate tumors of p18/ Pten+/ and p18+/ Pten+/ mice and absence of the wild-type Pten allele in half of the prostate tumors of Pten+/ mice. DNA extracted from the microdissected samples of mice of different genotypes was amplified by PCR to detect wild-type (wt) and mutant (mt) alleles of Pten and p18, respectively. (c) Presence of the wild-type Pten allele in other tumors of p18/ Pten+/, p18/ Pten+/, and Pten+/ mice. DNA extracted from the microdissected samples of mice of different genotypes was amplified by PCR to detect Pten and p18 alleles. (d) Summary of the expression pattern of Pten and p-Akt in different organ tumors from mutant mice. Pten and p-Akt expression levels were determined by IHC, and the results are shown as the number of Pten-negative samples divided by the number of p-Akt-positive samples, staining for the same tumor sample in consecutive sections. (e) Summary of LOH analysis of microdissected tumor samples by PCR. The results are shown as the number of LOH divided by the number of total samples examined.
FIG. 6.
FIG. 6.
Reduction or inactivation of the Rb pathway enhanced Akt activation in Pten+/ prostate cells. (a) Immunostaining for p-Akt of age-matched (9 months) prostates from mice of different genotypes. (b) Total cell lysates were prepared from the prostate tissues of mice of the indicated genotypes. Expression levels of total and Ser473-phosphorylated Akt were determined by Western blot analysis. Expression of p-Akt was quantified by using NIH Image (version 1.33u), and the relative level of p-Akt to total Akt is shown. (c, left) Total cell lysates were prepared from the indicated cell lines. Expression patterns of total and Ser473-phosphorylated Akt were determined by Western blot analysis. (Right) Overexpression CDK4 activated Akt. Cell lysates from the indicated cell lines infected with retroviruses expressing either CDK4 or GFP were prepared, and the steady-state levels of individual proteins were determined by Western blotting. (d) Inhibition of PI3K blocked Akt activation by CDK4. LNcap cells infected with either CDK4 or GFP were treated with LY294002 or dimethyl sulfoxide for 24 h, and then cell lysates were collected and analyzed by Western blotting. (e) Inactivation of Rb pathway-activated Akt and S6K. LNcap cells were transfected with pcDNA3-T121 or empty vector for 48 h, and cell lysates were collected and analyzed by Western blotting.

References

    1. Abate-Shen, C., and M. M. Shen. 2000. Molecular genetics of prostate cancer. Genes Dev. 14:2410-2434. - PubMed
    1. Bai, F., X. H. Pei, V. L. Godfrey, and Y. Xiong. 2003. Haploinsufficiency of p18INK4c sensitizes mice to carcinogen-induced tumorigenesis. Mol. Cell. Biol. 23:1269-1277. - PMC - PubMed
    1. Cantley, L. C. 2002. The phosphoinositide 3-kinase pathway. Science 296:1655-1657. - PubMed
    1. Cantley, L. C., and B. G. Neel. 1999. New insights into tumor suppression: PTEN suppresses tumor formation by restraining the phosphoinositide 3-kinase/AKT pathway. Proc. Natl. Acad. Sci. USA 96:4240-4245. - PMC - PubMed
    1. Chaussepied, M., and D. Ginsberg. 2004. Transcriptional regulation of AKT activation by E2F. Mol. Cell 16:831-837. - PubMed

Publication types

MeSH terms

Substances

LinkOut - more resources