. 2006 Jun;26(12):4586-600.
doi: 10.1128/MCB.01422-05.

Subcellular localization and biological actions of activated RSK1 are determined by its interactions with subunits of cyclic AMP-dependent protein kinase

Affiliations

Subcellular localization and biological actions of activated RSK1 are determined by its interactions with subunits of cyclic AMP-dependent protein kinase

Deepti Chaturvedi et al. Mol Cell Biol. 2006 Jun.

Abstract

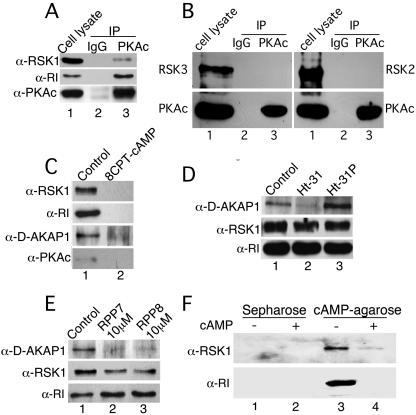
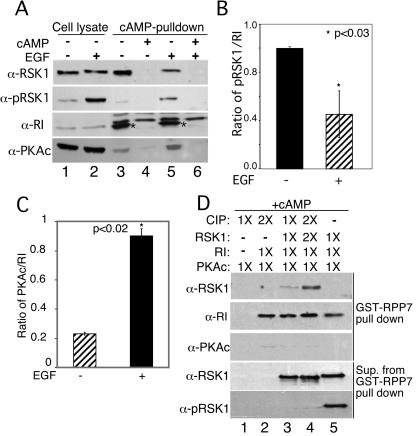
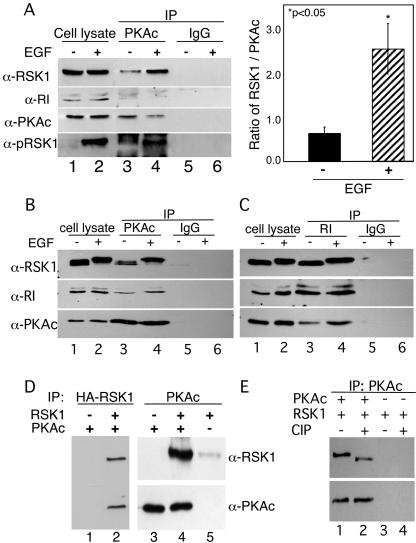
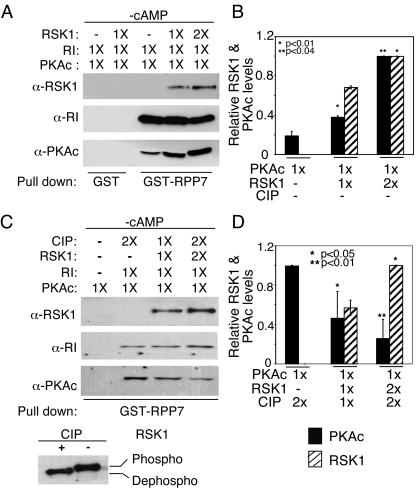
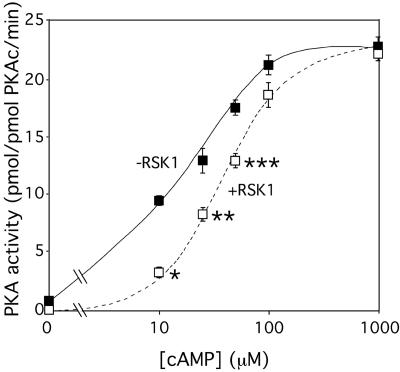
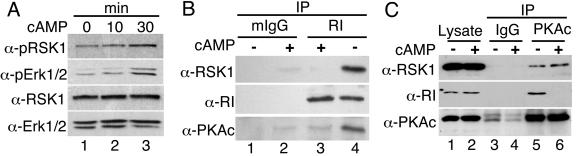
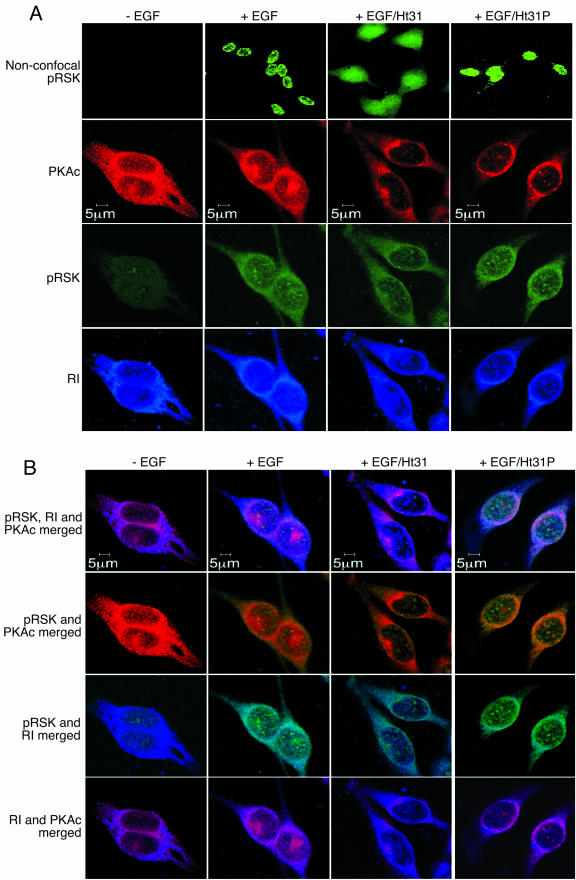
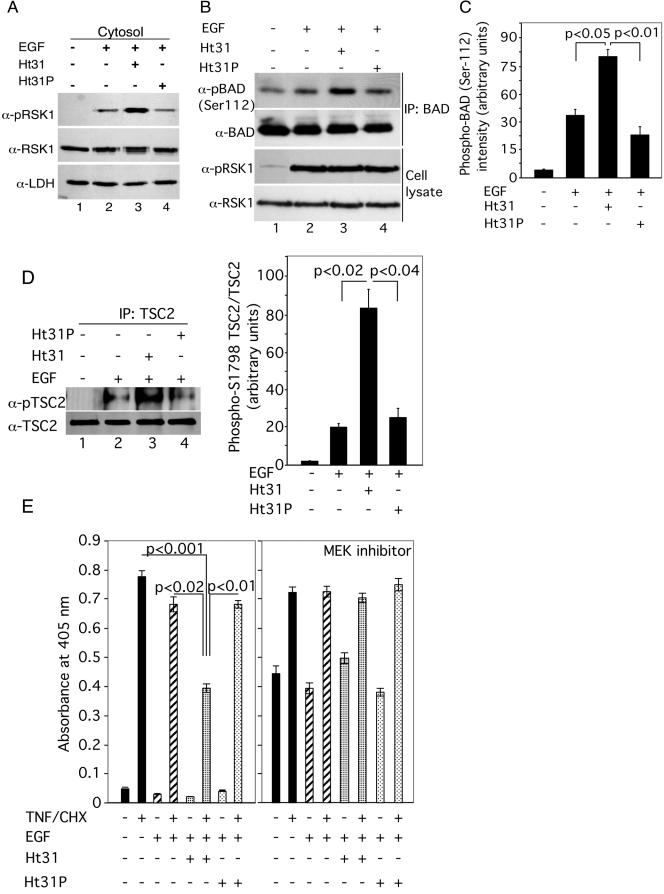
Cyclic AMP (cAMP)-dependent protein kinase (PKA) and ribosomal S6 kinase 1 (RSK1) share several cellular proteins as substrates. However, to date no other similarities between the two kinases or interactions between them have been reported. Here, we describe novel interactions between subunits of PKA and RSK1 that are dependent upon the activation state of RSK1 and determine its subcellular distribution and biological actions. Inactive RSK1 interacts with the type I regulatory subunit (RI) of PKA. Conversely, active RSK1 interacts with the catalytic subunit of PKA (PKAc). Binding of RSK1 to RI decreases the interactions between RI and PKAc, while the binding of active RSK1 to PKAc increases interactions between PKAc and RI and decreases the ability of cAMP to stimulate PKA. The RSK1/PKA subunit interactions ensure the colocalization of RSK1 with A-kinase PKA anchoring proteins (AKAPs). Disruption of the interactions between PKA and AKAPs decreases the nuclear accumulation of active RSK1 and, thus, increases its cytosolic content. This subcellular redistribution of active RSK1 is manifested by increased phosphorylation of its cytosolic substrates tuberous sclerosis complex 2 and BAD by epidermal growth factor along with decreased cellular apoptosis.


Figures

FIG. 1.
FIG. 1.
PKAc, RI, D-AKAP1, and RSK1 exist as a complex, and RSK1 associates directly with RI. (A) B82L or HeLa cells were serum starved overnight and subjected to IP with PKAc antibody or nonspecific IgG. RSK1 and RI, which coimmunoprecipitated with PKAc, were detected by immunoblotting. The example shown represents an experiment performed with HeLa cells. (B) Same as panel A except the presence of RSK2 or RSK3 in IPs of PKAc was monitored. Nonspecific rabbit IgG was used for control IPs. (C) RI from B82L cell lysates (500 μg protein) was pulled down with cAMP-agarose in the absence or presence of cAMP (50 mM), and the proteins associated with RI were detected by immunoblotting. (D) Same as panel C except the lysates were incubated in the absence or presence of 100 μM each Ht31 or Ht31P. (E) Same as panel C except RPP7 and RPP8 (10 μM each) replaced Ht31 and Ht31P. Representatives of at least two experiments for each set of conditions are shown. (F) Purified RI (3 pmol) and RSK1 (3 pmol) were incubated together. The RI was then pulled down with cAMP-agarose and, the proteins in the pull-down assay were analyzed by immunoblotting. Control pull-down assays were performed in the presence of 8-CPT-cAMP (50 mM) or Sepharose alone.
FIG. 2.
FIG. 2.
Inactive RSK1 associates preferentially with RI, while EGF-activated RSK1 interacts with PKAc. Serum-starved HeLa cells were treated with and without EGF (100 nM) for 10 min at 37°C. (A) The RI in the cell lysates was pulled down with cAMP-agarose in the presence or absence of 8-CPT-cAMP (50 mM). Total RSK1, phospho-T573-RSK1, PKAc, and RI in the pull-down assay were analyzed by immunoblotting. Asterisks show the migration of RI. (B) Quantitative analysis of three experiments similar to those whose results are shown in panel A. The ratios of RSK1/RI in the RI pull-down assays were calculated from densitometric scans. *, P < 0.03 (Student's unpaired t test analysis). (C) Quantitative analysis of three experiments similar to those whose results are shown in panel A. The ratios of PKAc/RI in the RI pull-down assays were calculated from densitometric scans. *, P < 0.02 (Student's unpaired t test analysis). (D) Purified RSK1 (3 pmol) was treated with 3 pmol (1×) or 6 pmol (2×) of alkaline CIP before incubation with reconstituted RI, PKAc, and GST-RPP7. cAMP (1 mM) was present in the GST-RPP7 pull-down assays, and the proteins were analyzed by immunoblotting. The supernatants (Sup.) from GST-RPP7 pull-down assays were analyzed for total RSK1 and phospho-RSK1 to confirm dephosphorylation of RSK1.
FIG. 3.
FIG. 3.
Active RSK1 interacts with PKAc in the absence of RI. (A) PKAc was IP from lysates of HeLa cells treated with or without EGF (100 nM) for 10 min. 8CPT-cAMP (100 μM) was added to cell lysates and IP buffers to dissociate PKAc from RI. The presence of total and phospho-RSK1 in the IPs was monitored by immunoblotting. Nonspecific rabbit IgG (IgG) was used for control IPs. Results representative of three experiments are shown. The right-hand panel shows the ratios of RSK1 to PKAc in IPs from three similar experiments. *, P < 0.05 (Student's t test). (B and C) Serum-starved HeLa cells were treated with and without EGF (100 nM) for 10 min at 37°C. PKAc (B) or RI (C) was immunoprecipitated from the lysates (500 μg protein). The presence of RI, PKAc, and RSK1 in the IPs was monitored by immunoblotting. Rabbit IgG (B) and mouse IgG (C) were used for control IPs. (D) Purified HA-tagged RSK1 (3 pmol) was mixed with PKAc (3 pmol). Anti-HA and anti-PKAc antibodies were used to IP RSK1 and PKAc, respectively. The presence of PKAc and RSK1 in the IPs was monitored by immunoblotting. (E) Purified RSK1 (3 pmol) treated with and without CIP was mixed with PKAc (3 pmol). Anti-PKAc antibody was used to IP PKAc. The presence of PKAc and RSK1 in the IPs was monitored by immunoblotting.
FIG. 4.
FIG. 4.
Phospho-RSK1 increases, while dephospho-RSK1 decreases, interactions between PKAc and RI. (A) Equimolar amounts (3 pmol each) of purified PKAc and RI were incubated for 10 min on ice and complexed with GST-RPP7 (10 pmol) as described in Materials and Methods. After the complex was washed, 3 pmol (1×) or 6 pmol (2×) of RSK1 was added. GST-RPP7 was pulled down, and the presence of the various proteins in the complex was determined by immunoblotting. GST-Sepharose served as a control. (B) The results of quantitative analysis of three experiments similar to those whose results are shown in panel A are presented as ratios of RSK1 or PKAc to RI. *, P < 0.01; **, P < 0.04 (Student's t test analysis). (C) CIP-treated RSK1 was mixed with reconstituted RI and PKAc as described for panel A. RI was pulled down with GST-RPP7, and the proteins were analyzed by immunoblotting. The difference in the levels of mobility of phospho- and dephospho-RSK1 before and after CIP treatment are shown in the bottom panel. (D) The results of quantitative analysis of three experiments similar to those whose results are shown in panel C are presented as ratios of RSK1 or PKAc to RI. *, P < 0.05; **, P < 0.01 (Student's t test analysis).
FIG. 5.
FIG. 5.
Active RSK1 inhibits PKA activity. Purified PKAc (1 pmol) was mixed with 20 pmol of purified RI. The PKA was then assayed for the kinase activity in the presence (+RSK1) and absence (−RSK1) of purified RSK1 (3 pmol) with or without PKI (25 μM). Various concentrations of cAMP were added to the reaction mix, and Kemptide phosphorylation was measured. The PKI-sensitive activity is shown. Data presented represent the means ± standard errors of the means (SEM) of at least three separate experiments. *, P < 0.001; **, P < 0.01; ***, P < 0.03 (Student's t test analyses compared to the corresponding control results).
FIG. 6.
FIG. 6.
Treatment of B82L cells with 8CPT-cAMP activates Erk1/2 as well as RSK1 and dissociates RSK1 from RI. (A) B82L cells (250,000 cells/35 mm dish) were treated with 8CPT-cAMP (100 μM) for the indicated times. Proteins (30 μg) were immunoblotted for phospho-RSK1, phospho-Erk1/2, total RSK1, and total Erk1/2. The last two served as loading controls. Results representing two similar experiments are shown. (B) B82L cells (1 × 10⁶ cells/100 mm dish) were treated with or without 8CPT-cAMP (100 μM) for 30 min. The RI was then immunoprecipitated from cell lysates (500 μg protein), and the presence of RSK1 in the IPs was monitored by immunoblotting. Mouse IgG2b (mIgG) was used in control IPs. Results representing three experiments are shown. (C) B82L cell lysates (500 μg protein) were treated with or without 8-CPT cAMP (100 μM) for 30 min. PKAc was then IP. RSK1 and RI in the IPs were monitored by immunoblotting. Rabbit IgG (IgG) was used in control IPs. Results representing three experiments is shown.
FIG. 7.
FIG. 7.
Active RSK1 and PKAc as well as RI are colocalized in the nucleus, and disruption of the PKA/AKAP decreases nuclear localization of RSK1. Serum-starved HeLa cells were preincubated with nothing or 20 μM each of the cell-permeable, stearated Ht31 or Ht31P peptides for 5 min and then treated with or without EGF (100 nM) for 15 min and fixed. Active phospho-RSK1 was detected using anti-phospho-T573 RSK1 antibody and goat anti-rabbit antibody conjugated to Alexa Fluor 488. PKAc was detected using anti-PKAc antibody (BD Bioscience) and goat anti-mouse antibody conjugated to Alexa Fluor 594. RI was monitored using biotinylated anti-RI antibody (BD Bioscience) and streptavidin-conjugated Pacific Blue. The top row in panel A shows nonconfocal images of the cells, whereas the other rows present confocal images showing the distribution of active RSK1, PKAc and RI. (B) The images in panel A were merged to show colocalization of the three proteins.
FIG. 8.
FIG. 8.
Dissociation of AKAPs from regulatory subunits of PKA alters the subcellular distribution of active RSK1, increases EGF-elicited phosphorylation of BAD and TSC2, and decreases cellular apoptosis. (A) HeLa cells were incubated exactly as described for Fig. 7 except that at the end of the incubations with or without EGF, the cells were lysed and cytosolic fractions were isolated. A representative Western blot with anti-pRSK1 antibody is shown. The same blot was reprobed with anti-lactate dehydrogenase (LDH) antibody as a loading control. (B) Serum-starved HeLa cells were treated with Ht31 or Ht31P for 10 min prior to treatment with EGF (100 nM) for 1 h. BAD was immunoprecipitated from cell lysates, and the amount of phospho-S112 BAD as well as of total BAD was monitored. Nonspecific rabbit IgG was used for control IPs. Lower panels: Western analyses of total cell lysates (20 μg protein) for the amounts of pRSK1 and RSK1. (C) Quantitative analyses of the ratio of phospho-S112 BAD/BAD in IPs from three experiments similar to those whose results are shown in panel B. Data represent the means ± SEM (n = 3). (D) Serum-starved HeLa cells were treated with Ht31 or Ht31P 10 min prior to treatment with EGF (100 nM) for 30 min. TSC2 was immunoprecipitated from cell lysates, and the amount of phospho-TSC2 at Ser1798 was monitored using anti-phospho-Akt substrate antibody (36). The blot was stripped and probed for total TSC2. Nonspecific rabbit IgG was used for control IPs. The right-hand panel shows quantitative analyses of the ratios of phospho-TSC2/TSC2 in the TSC2 IPs from three experiments. (E) Serum-starved HeLa cells (50,000 cells/well) were preincubated in the presence and absence of 20 μM concentrations each of the stearated Ht31 or Ht31P and, when present, 50 μM of MEK inhibitor PD98059 for 15 min followed by treatment with or without 100 nM EGF for 15 min. TNF-α (20 ng/ml) and cycloheximide (25 μg/ml) (TNF-α/CHX) were then added for 3 h, and DNA fragmentation was monitored. Data represent means ± SEM of the optical density at 405 nm per 50,000 cells (n = 6). Significant differences were assessed by Student's unpaired t test.

Similar articles

Cited by

References

    1. Abe, J., M. Okuda, Q. Huang, M. Yoshizumi, and B. C. Berk. 2000. Reactive oxygen species activate p90 ribosomal S6 kinase via Fyn and Ras. J. Biol. Chem. 275:1739-1748. - PubMed
    1. Alto, N. M., and J. D. Scott. 2004. The role of A-kinase anchoring proteins in cAMP-mediated signal transduction pathways. Cell Biochem. Biophys. 40:201-208. - PubMed
    1. Alto, N. M., J. Soderling, and J. D. Scott. 2002. Rab32 is an A-kinase anchoring protein and participates in mitochondrial dynamics. J. Cell Biol. 158:659-668. - PMC - PubMed
    1. Barbier, A. J., H. M. Poppleton, Y. Yigzaw, J. B. Mullenix, G. J. Wiepz, P. J. Bertics, and T. B. Patel. 1999. Transmodulation of epidermal growth factor receptor function by cyclic AMP-dependent protein kinase. J. Biol. Chem. 274:14067-14073. - PubMed
    1. Biondi, R. M., A. Kieloch, R. A. Currie, M. Deak, and D. R. Alessi. 2001. The PIF-binding pocket in PDK1 is essential for activation of S6K and SGK, but not PKB. EMBO J. 20:4380-4390. - PMC - PubMed

Publication types

MeSH terms