. 2006:2:2006.0003.
doi: 10.1038/msb4100045. Epub 2006 Jan 17.

Systems-level analyses identify extensive coupling among gene expression machines

Affiliations

Systems-level analyses identify extensive coupling among gene expression machines

Karolina Maciag et al. Mol Syst Biol. 2006.

Abstract

Here, we develop computational methods to assess and consolidate large, diverse protein interaction data sets, with the objective of identifying proteins involved in the coupling of multicomponent complexes within the yeast gene expression pathway. From among approximately 43 000 total interactions and 2100 proteins, our methods identify known structural complexes, such as the spliceosome and SAGA, and functional modules, such as the DEAD-box helicases, within the interaction network of proteins involved in gene expression. Our process identifies and ranks instances of three distinct, biologically motivated motifs, or patterns of coupling among distinct machineries involved in different subprocesses of gene expression. Our results confirm known coupling among transcription, RNA processing, and export, and predict further coupling with translation and nonsense-mediated decay. We systematically corroborate our analysis with two independent, comprehensive experimental data sets. The methods presented here may be generalized to other biological processes and organisms to generate principled, systems-level network models that provide experimentally testable hypotheses for coupling among biological machines.


Figures

Figure 1
Figure 1
Overview of method (see main text and Supplementary information for details). (A) Construction of an integrated protein interaction network. Nodes represent proteins and links represent protein interactions. Line thickness corresponds to link weight (w). Input (1), relative quality calculation (2), and integration (3) of networks defined by interaction data sets S1–S13 generate a comprehensive, weighted protein interaction network. Pairwise CC scores (CC) are computed (4) using local network weight and topology information. (B) Unsupervised identification of biologically significant clusters in the network using an iterative clustering algorithm based on CC scores. Each randomized selection of k initial centers (1, in our analysis, k=70) followed by iterations of cluster definition and center repositioning (2) yields a clustering (3); the best clustering from multiple trials, as defined in the text, is chosen (4). Clusters generated are functionally characterized (5). (C) Motifs in the interaction network identify direct (1), cluster-mediated (2), and adaptor-mediated (3) coupling among clusters.
Figure 2
Figure 2
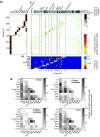
(A) Relationship between proteins, clusters, and annotation to gene expression subprocesses. (i) Assignment of proteins (vertical axis) to subprocesses (horizontal axis, labeled). Note that each protein may be annotated to more than one subprocess. Proteins are ordered along the vertical axis by the least abundant subprocess to which they belong. (ii) Assignment of proteins to clusters (horizontal axis). Proteins (vertical axis, as in (i)) are grouped into segments along the vertical axis containing four proteins at a time. For each segment, the number of proteins (out of a possible four) assigned to each cluster is shown, as indicated by the color bar. The frequencies of proteins in the cluster annotated to other, non-gene expression cell roles and proteins of unknown function are indicated in grayscale (top). Clusters are ordered along the horizontal axis by predominant functional annotation as determined in (iii). (iii) Annotation of clusters (horizontal axis) to subprocesses (vertical axis). The plot shows the P-value of statistical significance of enrichment of each cluster in proteins annotated to each subprocess. Clusters are ordered along the horizontal axis by predominant subprocess annotation. (B) Distribution of coupling among pairs of gene expression subprocesses. For each pair of subprocesses, plots indicate the frequency of cluster pairs that are significantly annotated to the respective subprocesses (P<0.05) and are linked by coupling motifs ranked in the top 30% of direct (top left), cluster-mediated (top right), and adaptor-mediated (bottom left) motifs. Frequencies of motif instances are indicated in grayscale. The sums of links using all three motifs are shown as well (bottom right).
Figure 3
Figure 3
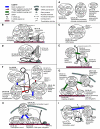
Protein clusters and top-ranking motifs suggest mechanisms of coupling between gene expression processes. Motifs described in the text are illustrated. For each cluster, n indicates the total number of proteins illustrated and m the total number of proteins in the cluster. For each specially noted subgroup of proteins within a cluster, P indicates the number of proteins in the subgroup. (A) Clusters may reconstruct well-known structural complexes. (B) Clusters reconstruct GTF machinery despite data missing from original data sets, and suggest conditional association of members in C8. (C) Seven DExD/H helicases in a single cluster identify a functional module. (D) Coupling of capping, elongation, and splicing suggested by the co-clustering and binding patterns of a cap-binding protein. (E) Top-ranked cluster-mediated coupling motif suggests coupling between elongation and mRNA quality control degradation. (F) Direct and adaptor-mediated coupling motifs suggest possible nuclear mRNA circularization, along with coupling among mRNA transcription and processing with export. (G) Cluster- and adaptor-mediated coupling motifs suggest coordination of transcription, export, and translation. (H) The top-ranking direct coupling motifs indicate possible coupling of mRNA export to chromatin silencing. (I) Direct coupling motif and co-clustering suggest coupling of transcription and mRNA export with translation and NMD, possibly at the nuclear pore.
Figure 4
Figure 4
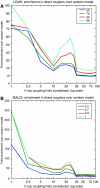
Fold enrichment of interactions in independent protein interaction data sets identified as direct coupling links in our model, as compared to randomized models. The independent, comprehensive protein interaction data sets were derived from systematic, previously unpublished complex precipitation studies using (A) LCMS and (B) MALDI-TOF mass spectrometry analysis. Shown are the fold enrichments of the number of interactions identified as direct couplers in the model used in this analysis, over the average number of interactions identified as direct couplers in 50 randomized models. The fold enrichment (y-axis) is shown as a function of the percentage of top-ranking direct coupling links considered (x-axis). Higher ranking links are more likely to appear in the independent data sets. Independent protein interaction data sets are subjected to thresholds at four different interaction confidence values (line colors). Higher quality interaction data demonstrates greater enrichment in our model versus in random models.

References

    1. Aguilera A (2005) Cotranscriptional mRNP assembly: from the DNA to the nuclear pore. Curr Opin Cell Biol 17: 242–250 - PubMed
    1. Albertini M, Pemberton LF, Rosenblum JS, Blobel G (1998) A novel nuclear import pathway for the transcription factor TFIIS. J Cell Biol 143: 1447–1455 - PMC - PubMed
    1. Ares M Jr, Proudfoot NJ (2005) The spanish connection: transcription and mRNA processing get even closer. Cell 120: 163–166 - PubMed
    1. Auty R, Steen H, Myers LC, Persinger J, Bartholomew B, Gygi SP, Buratowski S (2004) Purification of active TFIID from Saccharomyces cerevisiae. Extensive promoter contacts and co-activator function. J Biol Chem 279: 49973–49981 - PubMed
    1. Bader GD, Hogue CW (2002) Analyzing yeast protein–protein interaction data obtained from different sources. Nat Biotechnol 20: 991–997 - PubMed