. 2006:2:2006.0023.
doi: 10.1038/msb4100041. Epub 2006 Jan 17.

The proteomes of neurotransmitter receptor complexes form modular networks with distributed functionality underlying plasticity and behaviour

Affiliations

The proteomes of neurotransmitter receptor complexes form modular networks with distributed functionality underlying plasticity and behaviour

Andrew J Pocklington et al. Mol Syst Biol. 2006.

Abstract

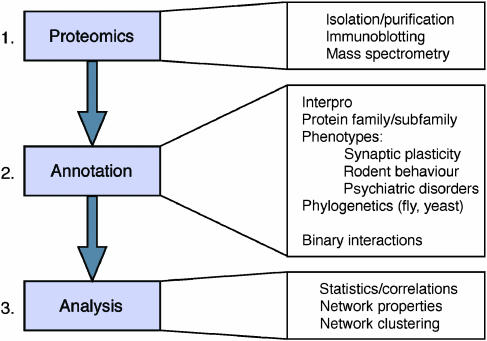
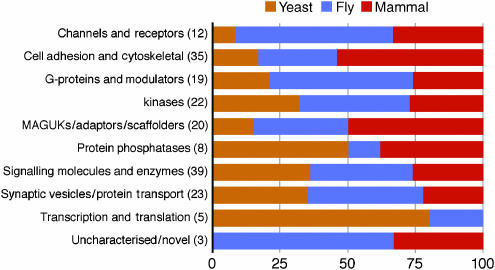
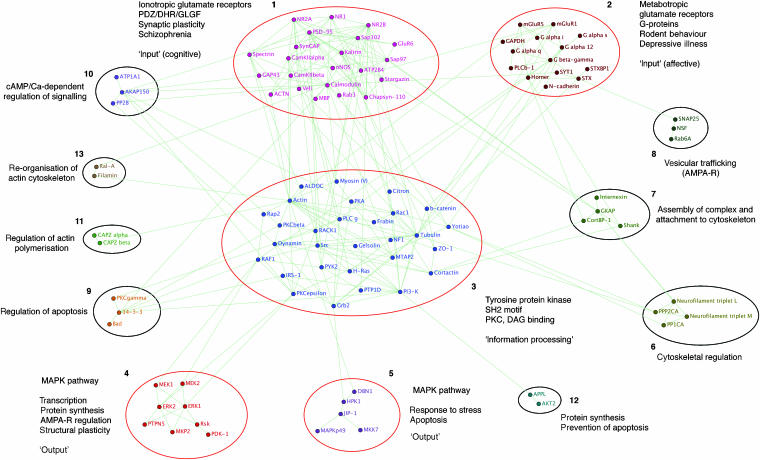
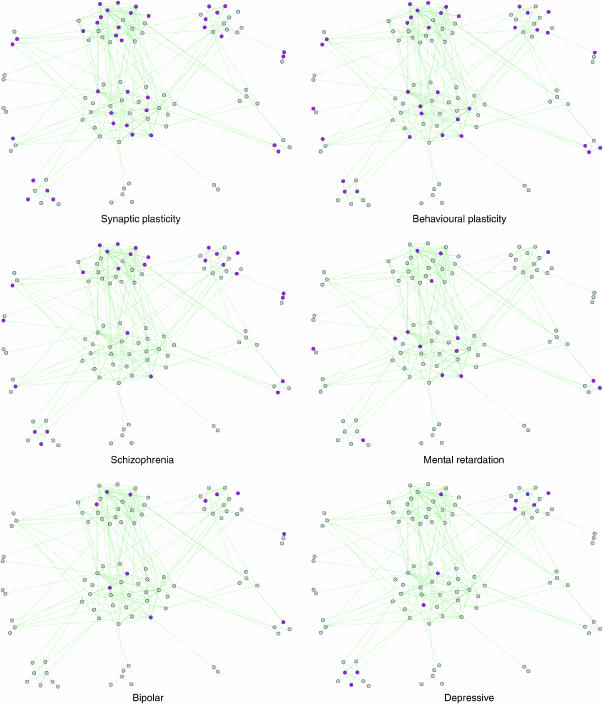
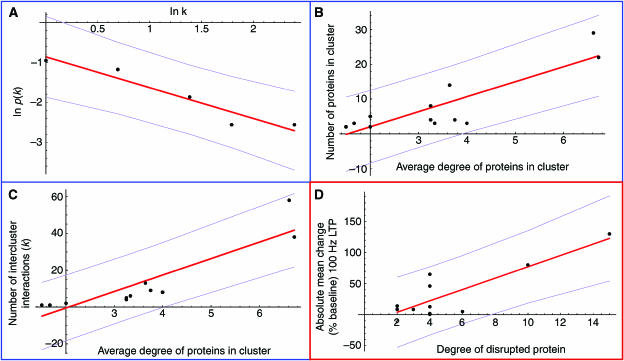
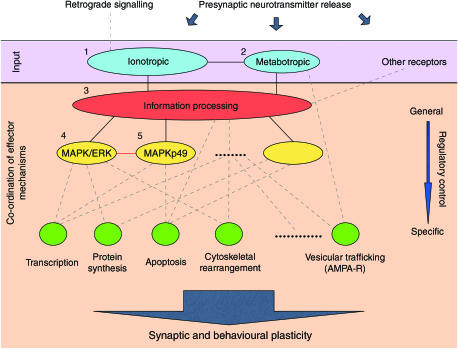
Neuronal synapses play fundamental roles in information processing, behaviour and disease. Neurotransmitter receptor complexes, such as the mammalian N-methyl-D-aspartate receptor complex (NRC/MASC) comprising 186 proteins, are major components of the synapse proteome. Here we investigate the organisation and function of NRC/MASC using a systems biology approach. Systematic annotation showed that the complex contained proteins implicated in a wide range of cognitive processes, synaptic plasticity and psychiatric diseases. Protein domains were evolutionarily conserved from yeast, but enriched with signalling domains associated with the emergence of multicellularity. Mapping of protein-protein interactions to create a network representation of the complex revealed that simple principles underlie the functional organisation of both proteins and their clusters, with modularity reflecting functional specialisation. The known functional roles of NRC/MASC proteins suggest the complex co-ordinates signalling to diverse effector pathways underlying neuronal plasticity. Importantly, using quantitative data from synaptic plasticity experiments, our model correctly predicts robustness to mutations and drug interference. These studies of synapse proteome organisation suggest that molecular networks with simple design principles underpin synaptic signalling properties with important roles in physiology, behaviour and disease.


Figures

Figure 1
Figure 1
A three-step strategy for analysis of synapse proteome organisation. Step 1 (Proteomics) was the collection of proteomic data identifying specific proteins. Step 2 (Annotation) was the collection of specific structural and functional data on individual proteins from Step 1, which was followed by Step 3 (Analysis) using statistical and network approaches.
Figure 2
Figure 2
Evolutionary expansion of protein families in MASC. Functional classes of proteins are represented as a horizontal line and the number of these proteins found in mouse MASC is shown in parenthesis. The percentage of each functional family making its earliest appearance in yeast (brown), fly (blue) or mammal (mouse, rat, human) (red) is indicated using the species-specific colour scheme. For example, only one out of 12 (8.5%) mammalian channels and receptors were found in yeast, in contrast to transcription and translation regulators, where four out of five (80%) were found in yeast. It is interesting to note that the novel/uncharacterised proteins arise in metazoans.
Figure 3
Figure 3
Network cluster analysis. Clustering of the largest connected component of the MASC network identified 13 clusters. Significant overlap with functional and phenotypic annotations is indicated for the largest clusters, 1–3. Clusters 4 and 5 both correspond to MAPK signalling pathways regulating various functional processes (briefly summarised). All five are followed by a brief descriptive phrase indicating their general functional role. Functional roles suggested by composition and interactions are indicated for the remaining clusters. Graphical representation of network produced using BioLayout (Enright and Ouzounis, 2001).
Figure 4
Figure 4
Network clustering—phenotypic overlay. Proteins with various phenotypes (electrophysiological, behavioural and human psychiatric) are highlighted within the MASC network. The layout of proteins, identical to that of Figure 3, reflects network clustering.
Figure 5
Figure 5
Support for model of MASC organisation. The model of MASC functional organisation makes several predictions: interconnectivity between modules follows a power law; protein degree is correlated with the size and interconnectivity of the enclosing module; and the degree of a protein is correlated with the perturbation of synaptic plasticity caused by its disruption. In all plots, the best linear fit is shown in red, with magenta lines at one standard deviation. (A) The probability p(k) of a cluster being connected to k other clusters is shown as a function of k in a log–log plot, a power-law distribution being characterised by a straight-line plot. (B) The number of proteins contained in a cluster is plotted as a function of their average degree. (C) The number of interactions with proteins external to a cluster is shown as a function of the average degree of proteins within the cluster. (D) The absolute change (% baseline) in 100 Hz LTP is shown as a function of the degree (number of interaction partners) of the protein disrupted. Where multiple sets of experimental data were available for a single protein, the absolute value of the mean experimentally recorded change was used (a significant linear fit was also evident for the full data set of 36 points).
Figure 6
Figure 6
Modular structure and functional organisation within MASC. MASC proteins are clustered into modules with well-defined functional roles. Primary signal reception modules (blue) are formed around ionotropic and metabotropic receptors. These inputs are integrated within a large signal-processing module (red) responsible for overall co-ordination of functional processes. Other sources of input (‘other receptors') may feed into this module directly, or through smaller input/processing modules (such as cluster 10, Figure 3). Note that, within this general structure, individual modules may play multiple functional roles (e.g. regulation of effector mechanisms by input modules 1 and 2). In this way, information processing and regulation of effector pathways are distributed over multiple modules. The general principles underlying functional organisation within MASC are apparent in the co-ordinated regulation of common downstream effector pathways: a single, large module (red) is responsible for overall co-ordination; several intermediate modules (yellow) regulate overlapping sets of pathways, while numerous small modules (green) are specific to individual effector responses. Note that this is not a simple feed-forward mechanism, rather a dynamical balance between multiple functional processes. The resulting synchronisation of multiple cell-biological processes induces synaptic plasticity, manifest at a higher level of neurological function through behavioural learning. Numbering of the five largest clusters reflects that of Figure 3, as do the interactions between them (solid black lines). Internal/external modulation of MASC function and the regulation of effector mechanisms are denoted by dashed lines. The red line between clusters 4 and 5 denotes the fact that other interactions (e.g. phosphorylation) play an important role in MASC function.

References

    1. Albert R, Jeong H, Barabasi AL (2000) Error and attack tolerance of complex networks. Nature 406: 378–382 - PubMed
    1. Bliss TV, Collingridge GL (1993) A synaptic model of memory: long-term potentiation in the hippocampus. Nature 361: 31–39 - PubMed
    1. Collins MO, Husi H, Yu L, Brandon JM, Anderson CNG, Blackstock WP, Choudhary J, Grant SGN (2005) Molecular characterization and comparison of the components and multi-protein complexes in the postsynaptic density. J Neurochemistry. Online Early, doi:10.1111/j.1471-4159.2005.03507.x - PubMed
    1. Csete M, Doyle J (2004) Bow ties, metabolism and disease. Trends Biotechnol 22: 446–450 - PubMed
    1. Enright AJ, Ouzounis CA (2001) BioLayout—an automatic graph layout algorithm for similarity visualization. Bioinformatics 17: 853–854 - PubMed

Publication types

MeSH terms