. 2006 Jun 2:7:280.
doi: 10.1186/1471-2105-7-280.

Integrated biclustering of heterogeneous genome-wide datasets for the inference of global regulatory networks

Affiliations

Integrated biclustering of heterogeneous genome-wide datasets for the inference of global regulatory networks

David J Reiss et al. BMC Bioinformatics. .

Abstract

Background: The learning of global genetic regulatory networks from expression data is a severely under-constrained problem that is aided by reducing the dimensionality of the search space by means of clustering genes into putatively co-regulated groups, as opposed to those that are simply co-expressed. Be cause genes may be co-regulated only across a subset of all observed experimental conditions, biclustering (clustering of genes and conditions) is more appropriate than standard clustering. Co-regulated genes are also often functionally (physically, spatially, genetically, and/or evolutionarily) associated, and such a priori known or pre-computed associations can provide support for appropriately grouping genes. One important association is the presence of one or more common cis-regulatory motifs. In organisms where these motifs are not known, their de novo detection, integrated into the clustering algorithm, can help to guide the process towards more biologically parsimonious solutions.

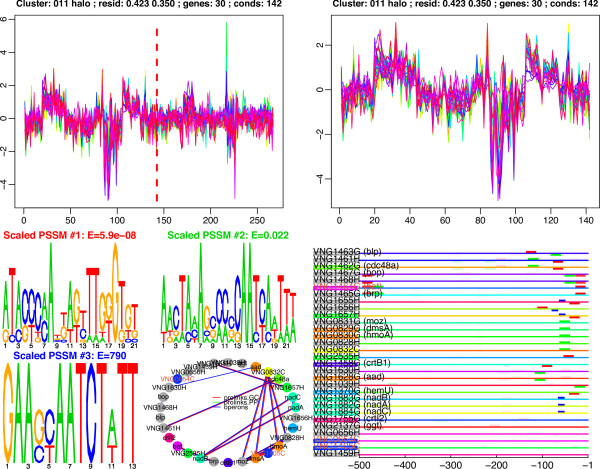
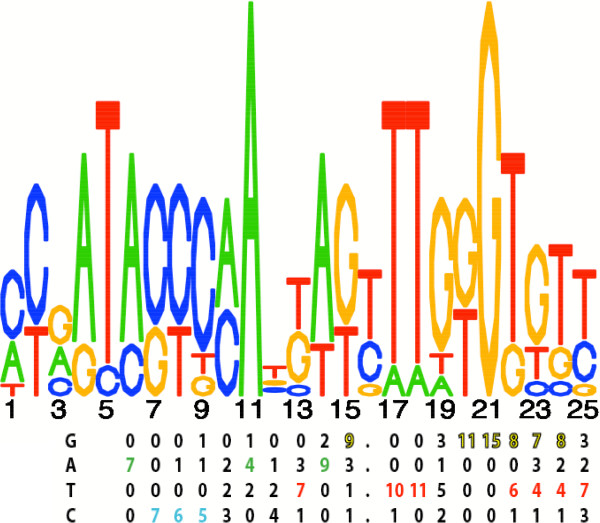
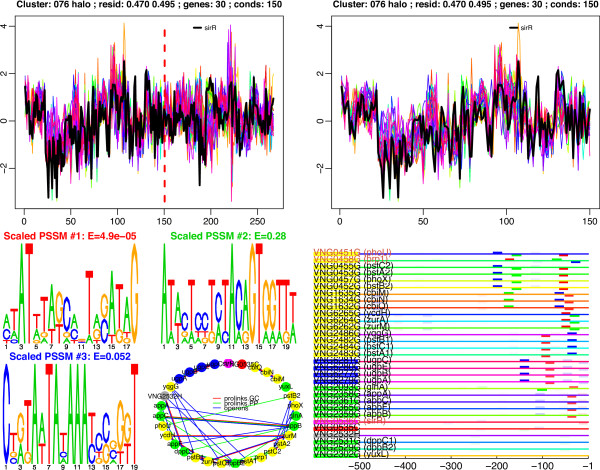
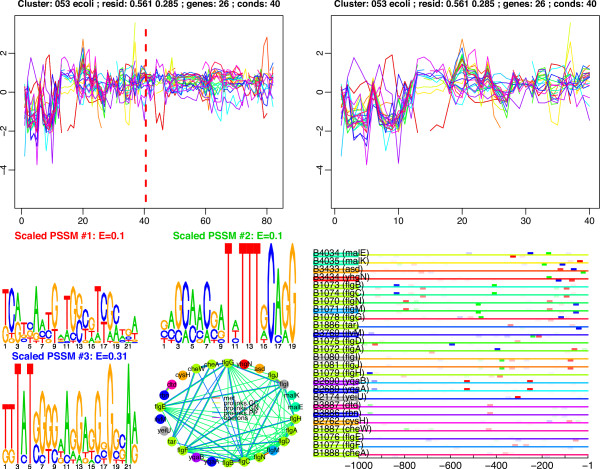
Results: We have developed an algorithm, cMonkey, that detects putative co-regulated gene groupings by integrating the biclustering of gene expression data and various functional associations with the de novo detection of sequence motifs.

Conclusion: We have applied this procedure to the archaeon Halobacterium NRC-1, as part of our efforts to decipher its regulatory network. In addition, we used cMonkey on public data for three organisms in the other two domains of life: Helicobacter pylori, Saccharomyces cerevisiae, and Escherichia coli. The biclusters detected by cMonkey both recapitulated known biology and enabled novel predictions (some for Halobacterium were subsequently confirmed in the laboratory). For example, it identified the bacteriorhodopsin regulon, assigned additional genes to this regulon with apparently unrelated function, and detected its known promoter motif. We have performed a thorough comparison of cMonkey results against other clustering methods, and find that cMonkey biclusters are more parsimonious with all available evidence for co-regulation.


Figures

Figure 1
Figure 1
Bacteriorhodopsin Halobacterium bicluster with known Bat-binding motif (UAS). A: expression ratios of the bicluster's genes, over all experimental conditions (conditions within the bicluster are to the left of the red dotted line). B: expression ratios over only the conditions within the bicluster. C: motif logos [74] and E-values [10] for motifs that were detected in the bicluster. D: network of associations between the bicluster's genes in the various association networks used by CMONKEY, including operons, KEGG [48] metabolic pathways ("met" – see Methods; only present in Figures 4 and 5), and Prolinks [23] associations. The nodes are color coded by COG [89] functional groupings. Genes labeled in red text encode known or putative transcriptional regulators. E: diagram of the upstream positions of the motifs, colored red, green and blue for motifs #1, 2 and 3, respectively. The genes' names are color-coded by COG functional annotation as in the network subfigure. The colors of the lines for each gene's sequence correspond to those in the expression ratio plots.
Figure 2
Figure 2
Motif logo for Bat-binding motif discovered in the bicluster of Figure 1 (top) compared to the saturation mutagenesis pattern observed for this regulator [12] (bottom).
Figure 3
Figure 3
Halobacterium bicluster containing genes encoding the members of several transporter complexes. While sirR was not included by CMONKEY in the bicluster, we have added it to the figure and highlighted its expression profile.
Figure 4
Figure 4
Flagellar biosynthesis bicluster from E. coli. Motifs #1 and 2 make up part of the σ70(RpoD)/FlhDC activator complex binding site for activation of Class-2 flagellar genes.
Figure 5
Figure 5
Flagellar-function H. pylori bicluster with known RpoN-binding motif (motif #1).
Figure 6
Figure 6
Mean external measures of Halobacterium bicluster "quality", as a function of iteration of bicluster optimization. Left: co-expression ("residual," [98]). Center: motif co-occurrence ("Motif log(p-value)"). Right: mutual clustering coefficient (log-p-value [37]) in four different association networks: operons, KEGG [48] metabolic pathways ("met" – see Methods), and Prolinks [23] associations.
Figure 7
Figure 7
Halobacterium bicluster network as visualized using Cytoscape [78]. Biclusters are represented as rectangular nodes, colored based upon significant functional annotations [40]. Different colored edges represent different measures of cluster similarity or connectivity in various association networks (dark blue: KEGG [48] metabolic pathways; dark red: GO [40] functional similarity; light blue: motif similarity; yellow: operon membership; light red: COG [89] functional similarity; green: gene membership). Highly-connected (and therefore functionally-related) biclusters are placed near each other in the layout. The selected (grey) bicluster group near the bottom contains bacteriorhodopsin-associated biclusters, including the one in Fig. 1. Note that these biclusters have not been filtered to remove redundancy.
Figure 8
Figure 8
A schematic diagram of the CMONKEY biclustering procedure. The inner (red) loop depicts the optimization for each newly-seeded bicluster.
Figure 9
Figure 9
Example annealing schedule applied to the three CMONKEY model component weights (r0, p0, and q0) and annealing temperature T, during a bicluster optimization, as a function of iteration.

References

    1. European bioinformatics institute gene ontology annotations http://www.ebi.ac.uk/GOA/proteomes.html
    1. Kegg genomes web site ftp://ftp.genome.ad.jp/pub/kegg/genomes/
    1. Stanford microarray database http://genome-www5.stanford.edu
    1. CMONKEY web site http://halo.systemsbiology.net/cmonkey
    1. The R project for statistical computing http://www.r-project.org

Publication types

LinkOut - more resources