. 2006 Jun 13;103(24):9357-62.
doi: 10.1073/pnas.0603161103. Epub 2006 Jun 2.

Genome-wide RNAi screen of Ca(2+) influx identifies genes that regulate Ca(2+) release-activated Ca(2+) channel activity

Affiliations

Genome-wide RNAi screen of Ca(2+) influx identifies genes that regulate Ca(2+) release-activated Ca(2+) channel activity

Shenyuan L Zhang et al. Proc Natl Acad Sci U S A. .

Abstract

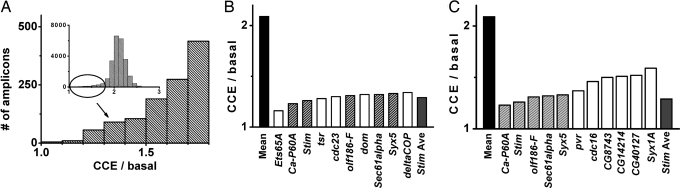
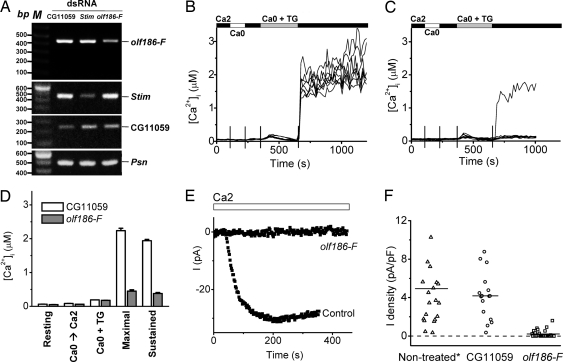
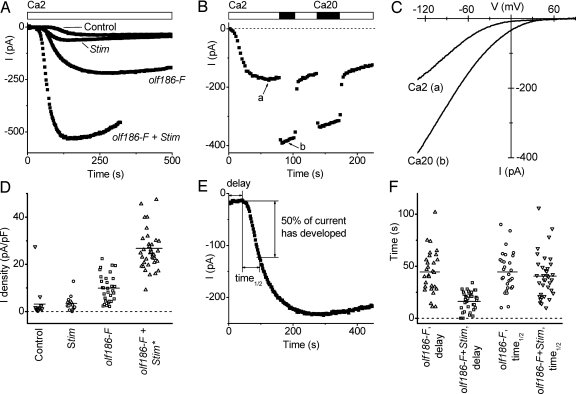
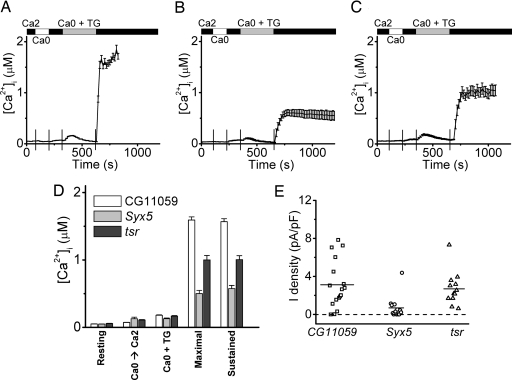
Recent studies by our group and others demonstrated a required and conserved role of Stim in store-operated Ca(2+) influx and Ca(2+) release-activated Ca(2+) (CRAC) channel activity. By using an unbiased genome-wide RNA interference screen in Drosophila S2 cells, we now identify 75 hits that strongly inhibited Ca(2+) influx upon store emptying by thapsigargin. Among these hits are 11 predicted transmembrane proteins, including Stim, and one, olf186-F, that upon RNA interference-mediated knockdown exhibited a profound reduction of thapsigargin-evoked Ca(2+) entry and CRAC current, and upon overexpression a 3-fold augmentation of CRAC current. CRAC currents were further increased to 8-fold higher than control and developed more rapidly when olf186-F was cotransfected with Stim. olf186-F is a member of a highly conserved family of four-transmembrane spanning proteins with homologs from Caenorhabditis elegans to human. The endoplasmic reticulum (ER) Ca(2+) pump sarco-/ER calcium ATPase (SERCA) and the single transmembrane-soluble N-ethylmaleimide-sensitive (NSF) attachment receptor (SNARE) protein Syntaxin5 also were required for CRAC channel activity, consistent with a signaling pathway in which Stim senses Ca(2+) depletion within the ER, translocates to the plasma membrane, and interacts with olf186-F to trigger CRAC channel activity.


Conflict of interest statement

Conflict of interest statement: No conflicts declared.

Figures

Fig. 1.
Fig. 1.
Identification of genes involved in store-operated calcium entry. (A) The effect of individual gene silencing on TG-evoked Ca2+ entry (CCE) relative to basal Ca2+, displayed as a histogram. (Inset) The distribution of averaged CCE/basal values for each well. Low values of CCE/basal are enlarged to show the tail of the distribution, representing amplicons that dramatically suppressed TG-evoked calcium entry. (B) The top 10 hits with strongest effect on TG-evoked Ca2+ influx. Averaged values of CCE/basal are shown for all 48,384 wells tested in the assay (“mean”), for the top 10 hits from the screen, and for the positive control well that contained Stim dsRNA in each assay plate (“Stim Ave”). Striped bars represent hits with transmembrane regions. (C) Transmembrane (TM) protein hits.
Fig. 2.
Fig. 2.
Suppression of TG-dependent Ca2+ influx and CRAC current by olf186-F dsRNA. (A) Reduction of olf186-F mRNA expression in olf186-F dsRNA-treated cells. RT-PCR analysis on olf186-F, Stim, CG11059, and a control gene, Presenilin (Psn). (B) [Ca2+]i in eight representative S2 cells treated with CG11059 dsRNA. Solution exchanges are indicated. (C) [Ca2+]i in eight cells treated with olf186-F dsRNA. (D) Averaged [Ca2+]i values ± SEM for control cells (n = 195 cells in three experiments; white bars) and olf186-F dsRNA-treated cells (n = 189 in four experiments; gray bars): resting [Ca2+]i, peak value upon readdition of 2 mM external Ca2+ before TG treatment (Ca0 → Ca2), peak [Ca2+]i during TG-evoked release transient (Ca0 + TG), and maximal and sustained (3 min) [Ca2+]i after readdition of 2 mM external Ca2+. (E) Representative time course of whole-cell currents recorded in control cells treated with CG11059 dsRNA and in cells treated with olf186-F dsRNA. (F) Suppression of CRAC current by olf186-F dsRNA pretreatment. Each point represents the maximal inward CRAC current density (pA/pF) in a single cell, plotted as absolute values in consecutive order from left to right within three groups of cells: untreated, cells treated with dsRNA to suppress CG11059, or olf186-F (P < 5 × 10⁻⁶ compared with either control group). The untreated cell group includes two cells each with current density >12 pA/pF. Horizontal lines indicate the mean value of current density in each group.
Fig. 3.
Fig. 3.
Overexpression of olf186-F leads to increased CRAC currents in S2 cells. (A) Representative CRAC currents in S2 cells transfected with GFP only (control), Stim, olf186-F, and olf186-F plus Stim. (B) Ca2+ current in olf186-F + Stim cotransfected cell. Arrows a and b indicate the time corresponding to current–voltage curves in C. (C) Current–voltage relationship of CRAC current in the same cell. (D) CRAC current density in transfected S2 cells, plotted as in Fig. 2F, within four groups of cells: GFP-transfected control; Stim and GFP cotransfected (not significantly different from controls); olf186-F and GFP cotransfected (P < 10−3); and olf186-F, Stim, and GFP cotransfected (P < 5 × 10⁻⁶). The group of cells cotransfected by olf186-F, Stim, and GFP includes one cell with current density >50 pA/pF. (E) Method to analyze kinetics of CRAC current development. (F) Effect of cotransfected Stim on delay kinetics. Delay times are significantly reduced (P < 5 × 10⁻⁶), but time1/2 values are not altered when Stim is expressed together with olf186-F, compared with olf186-F alone.
Fig. 4.
Fig. 4.
Effects of Ca-P60A dsRNA on Ca2+ dynamics in individual S2 cells. (A) Averaged [Ca2+]i in cells treated with control CG11059 dsRNA. (B) Averaged [Ca2+]i in cells treated with Ca-P60A dsRNA. (C and D) Ca2+ release evoked by 1 μM ionomycin in control cells and in cells treated with Ca-P60A dsRNA to knock down SERCA expression. (E) Averaged [Ca2+]i values ± SEM for control cells (white bars) and Ca-P60A dsRNA-treated cells (gray bars) labeled as in Fig. 2D and including peak [Ca2+]i during ionomycin-evoked release transient (Ca0 + Iono). (F) Summary of inward CRAC current densities in control CG11059- and Ca-P60A dsRNA-treated cells (P = 0.002), using the same plotting format as in Fig. 2F.
Fig. 5.
Fig. 5.
Suppression of Ca2+ influx and CRAC current by Syx5 and tsr dsRNA. (AC) Averaged [Ca2+]i in cells treated with control CG11059 dsRNA (A), Syx5 dsRNA (B), or tsr dsRNA (C). (D) Averaged [Ca2+]i values ± SEM for control cells (white bars), Syx5 dsRNA-treated cells (gray bars), and tsr dsRNA-treated cells (black bars) labeled as in Fig. 2D. (E) Summary of inward CRAC current densities in Syx5 and tsr dsRNA-treated cells, using the same plotting format as in Fig. 2F. Mean values for CG11059 and Syx5 are significantly different (P = 0.004). The mean values for CG11059 and tsr are not significantly different (P = 0.65).

References

    1. Prakriya M., Lewis R. S. Cell Calcium. 2003;33:311–321. - PubMed
    1. Parekh A. B., Putney J. W., Jr Physiol. Rev. 2005;85:757–810. - PubMed
    1. Gallo E. M., Cante-Barrett K., Crabtree G. R. Nat. Immunol. 2006;7:25–32. - PubMed
    1. Yeromin A. V., Roos J., Stauderman K. A., Cahalan M. D. J. Gen. Physiol. 2004;123:167–182. - PMC - PubMed
    1. Roos J., DiGregorio P. J., Yeromin A. V., Ohlsen K., Lioudyno M., Zhang S., Safrina O., Kozak J. A., Wagner S. L., Cahalan M. D., et al. J. Cell Biol. 2005;169:435–445. - PMC - PubMed

Publication types

MeSH terms

LinkOut - more resources