. 2006 Jun;72(6):3975-83.
doi: 10.1128/AEM.02771-05.

Succession of bacterial communities during early plant development: transition from seed to root and effect of compost amendment

Affiliations

Succession of bacterial communities during early plant development: transition from seed to root and effect of compost amendment

Stefan J Green et al. Appl Environ Microbiol. 2006 Jun.

Abstract

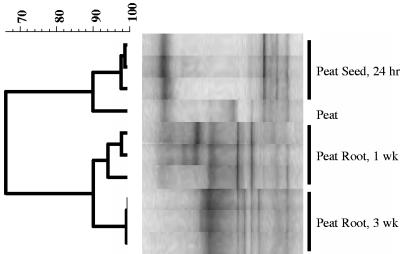
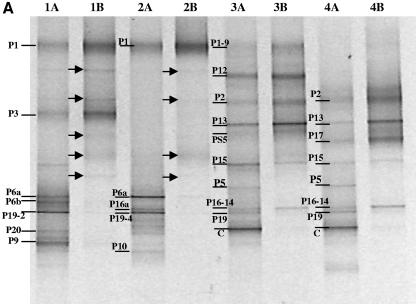
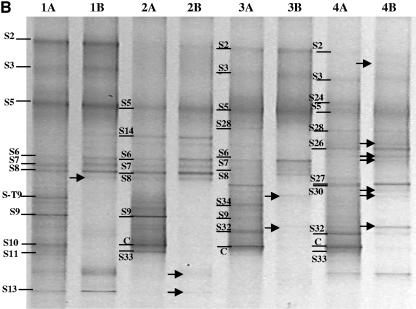
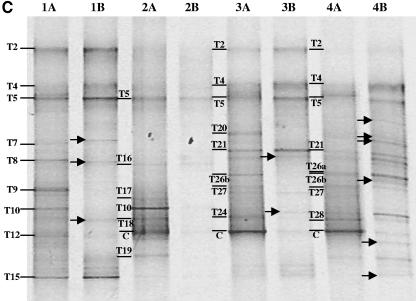
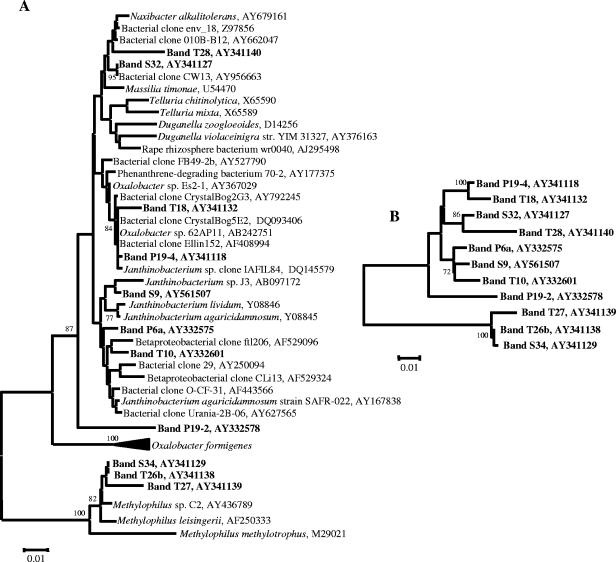
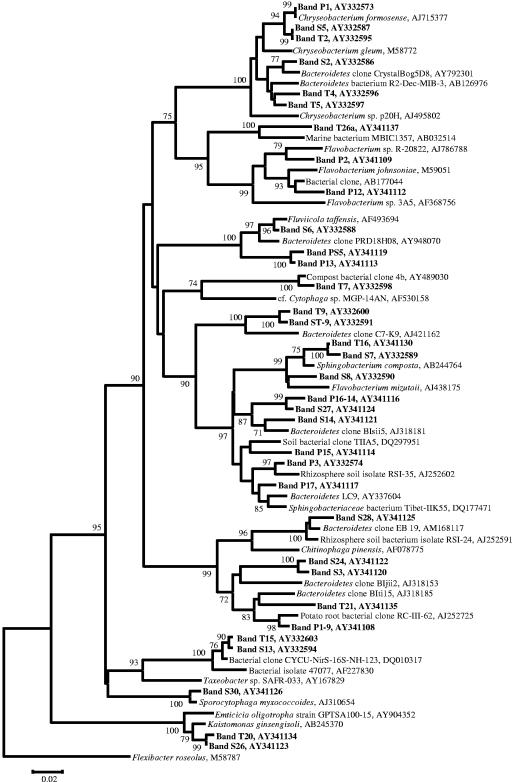
Compost amendments to soils and potting mixes are routinely applied to improve soil fertility and plant growth and health. These amendments, which contain high levels of organic matter and microbial cells, can influence microbial communities associated with plants grown in such soils. The purpose of this study was to follow the bacterial community compositions of seed and subsequent root surfaces in the presence and absence of compost in the potting mix. The bacterial community compositions of potting mixes, seed, and root surfaces sampled at three stages of plant growth were analyzed via general and newly developed Bacteroidetes-specific, PCR-denaturing gradient gel electrophoresis methodologies. These analyses revealed that seed surfaces were colonized primarily by populations detected in the initial potting mixes, many of which were not detected in subsequent root analyses. The most persistent bacterial populations detected in this study belonged to the genus Chryseobacterium (Bacteroidetes) and the family Oxalobacteraceae (Betaproteobacteria). The patterns of colonization by populations within these taxa differed significantly and may reflect differences in the physiology of these organisms. Overall, analyses of bacterial community composition revealed a surprising prevalence and diversity of Bacteroidetes in all treatments.


Figures

FIG. 1.
FIG. 1.
A representative dendrogram depicting the similarity of profiles of bacterial communities generated from PCR-DGGE analyses of replicate samples of seed (24 h) and root (1 and 3 weeks) from cucumber grown in the peat-only potting mix. Bacterial community profiles were generated by PCR-DGGE analysis as described in the text. The UPGMA algorithm was applied to a similarity matrix of Pearson product moment correlation coefficients (r values) generated from the DGGE banding patterns.
FIG.2.
FIG.2.
PCR-DGGE analysis of partial 16S rRNA genes amplified from the peat-only (A), sawdust compost (B), and straw compost (C) treatments. For each treatment, PCR-DGGE profiles for potting mix from the time of sowing (lanes 1), seed surface after 24 h of incubation in the potting mix (lanes 2), roots after 1 week of growth in the potting mix (lanes 3), and roots after 3 weeks of growth in the potting mix (lanes 4) are shown. DNA samples were initially amplified with a general bacterial primer set (lanes A) or with a Bacteroidetes primer set (lanes B) and then subjected to nested PCR with general bacterial primers appropriate for DGGE analysis, as described in the text. Excised, cloned, and sequenced bands are labeled and are discussed in the text. Populations detected only in the Bacteroidetes-enhanced PCR-DGGE analyses are indicated by arrows.
FIG.2.
FIG.2.
PCR-DGGE analysis of partial 16S rRNA genes amplified from the peat-only (A), sawdust compost (B), and straw compost (C) treatments. For each treatment, PCR-DGGE profiles for potting mix from the time of sowing (lanes 1), seed surface after 24 h of incubation in the potting mix (lanes 2), roots after 1 week of growth in the potting mix (lanes 3), and roots after 3 weeks of growth in the potting mix (lanes 4) are shown. DNA samples were initially amplified with a general bacterial primer set (lanes A) or with a Bacteroidetes primer set (lanes B) and then subjected to nested PCR with general bacterial primers appropriate for DGGE analysis, as described in the text. Excised, cloned, and sequenced bands are labeled and are discussed in the text. Populations detected only in the Bacteroidetes-enhanced PCR-DGGE analyses are indicated by arrows.
FIG. 3.
FIG. 3.
Neighbor-joining phylogenetic trees of detected betaproteobacterial populations. Bootstrapped neighbor-joining trees were generated with 1,000 resamplings, and nodes with bootstrap values of greater than 70% are indicated, as described in the text. Band numbers refer to bands isolated from DGGE analyses. The scale bars represent 0.01 substitution per nucleotide position. A: Phylogenetic tree of betaproteobacterial sequences recovered from DGGE bands and most similar sequences as identified by BLAST. B: Phylogenetic tree of betaproteobacterial sequences recovered from DGGE bands alone.
FIG. 4.
FIG. 4.
Neighbor-joining phylogenetic tree of Bacteroidetes populations detected in the study. Bootstrapped neighbor-joining trees were generated with 1,000 resamplings, as described in the text. Band numbers refer to bands isolated from DGGE analyses. Nodes with bootstrap values of greater than 70% are labeled. The scale bar represents 0.02 substitution per nucleotide position.

Similar articles

Cited by

References

    1. Alfreider, A., S. Peters, C. C. Tebbe, A. Rangger, and H. Insam. 2002. Microbial community dynamics during composting of organic matter as determined by 16S ribosomal DNA analysis. Comp. Sci. Util. 10:303-312.
    1. Altschul, S. F., T. L. Madden, A. A. Schaffer, J. Zhang, Z. Zhang, W. Miller, and D. J. Lipman. 1997. Gapped BLAST and PSI-BLAST: a new generation of protein database search programs. Nucleic Acids Res. 25:3389-3402. - PMC - PubMed
    1. Baudoin, E., E. Benizri, and A. Guckert. 2002. Impact of growth stage on the bacterial community structure along maize roots, as determined by metabolic and genetic fingerprinting. Appl. Soil Ecol. 19:135-145.
    1. Bazin, M. J., P. Markham, and E. M. Scott. 1990. Population dynamics and rhizosphere interactions, p. 99-127. In J. M. Lynch (ed.), The rhizosphere. John Wiley & Sons, Ltd., West Sussex, United Kingdom.
    1. Beffa, T., M. Blanc, L. Marilley, J. L. Fischer, P. F. Lyon, and M. Aragno. 1996. Taxonomic and metabolic microbial diversity during composting, p. 149-161. In M. De Bertoldi, P. Sequi, B. Lemmes, and T. Papi (ed.), The science of composting. M. Chapman and Hall, London, United Kingdom.

Publication types

MeSH terms

Associated data

LinkOut - more resources