. 2006 Jul;15(7):1653-66.
doi: 10.1110/ps.062095806. Epub 2006 Jun 2.

A composite score for predicting errors in protein structure models

Affiliations

A composite score for predicting errors in protein structure models

David Eramian et al. Protein Sci. 2006 Jul.

Abstract

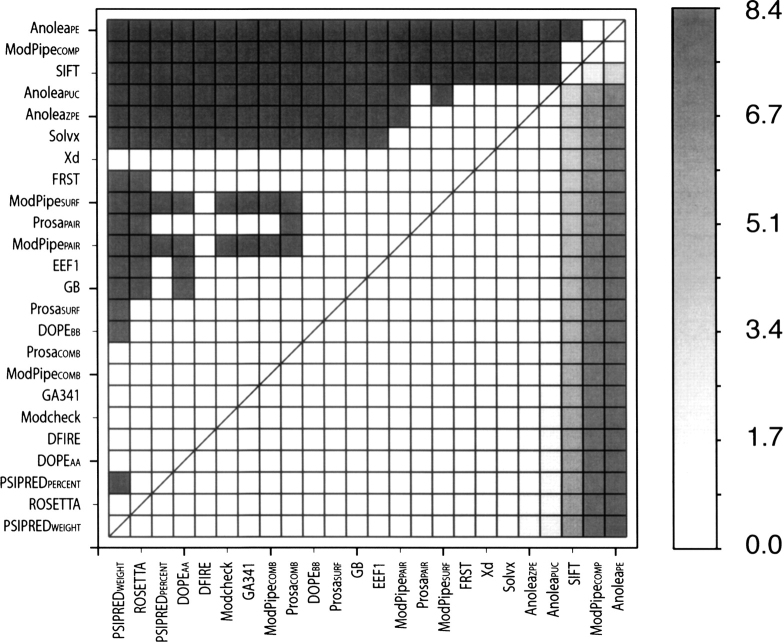
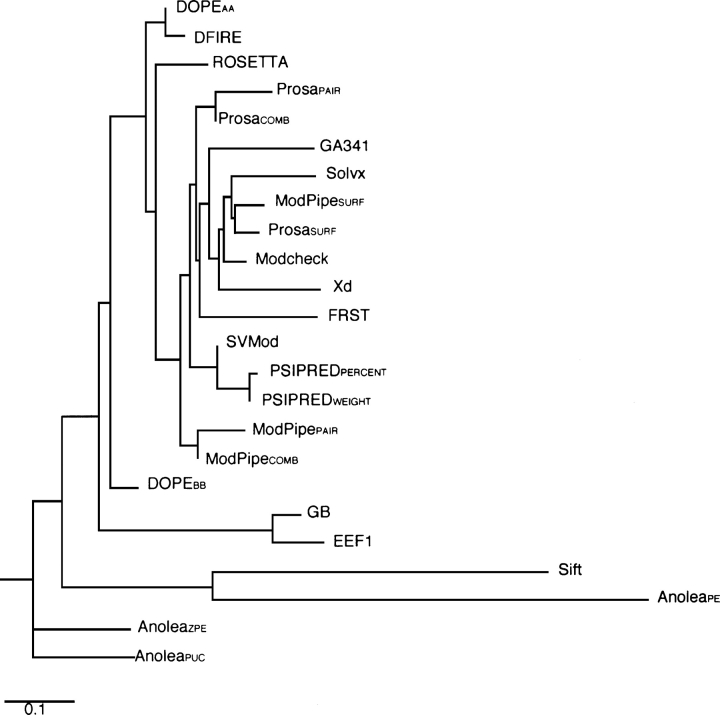
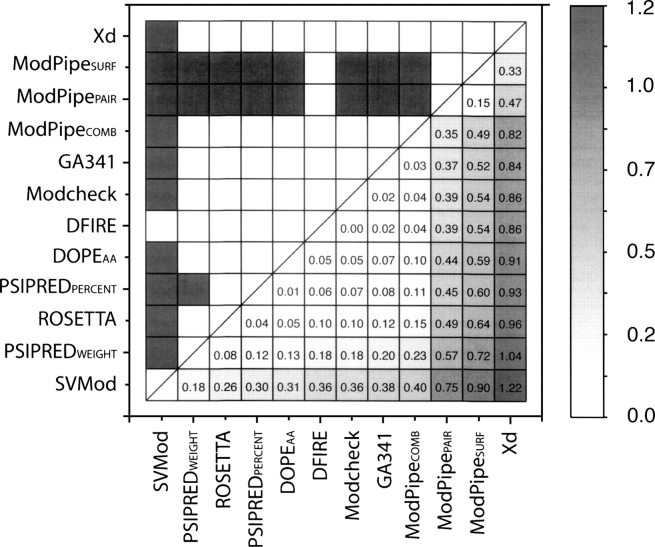
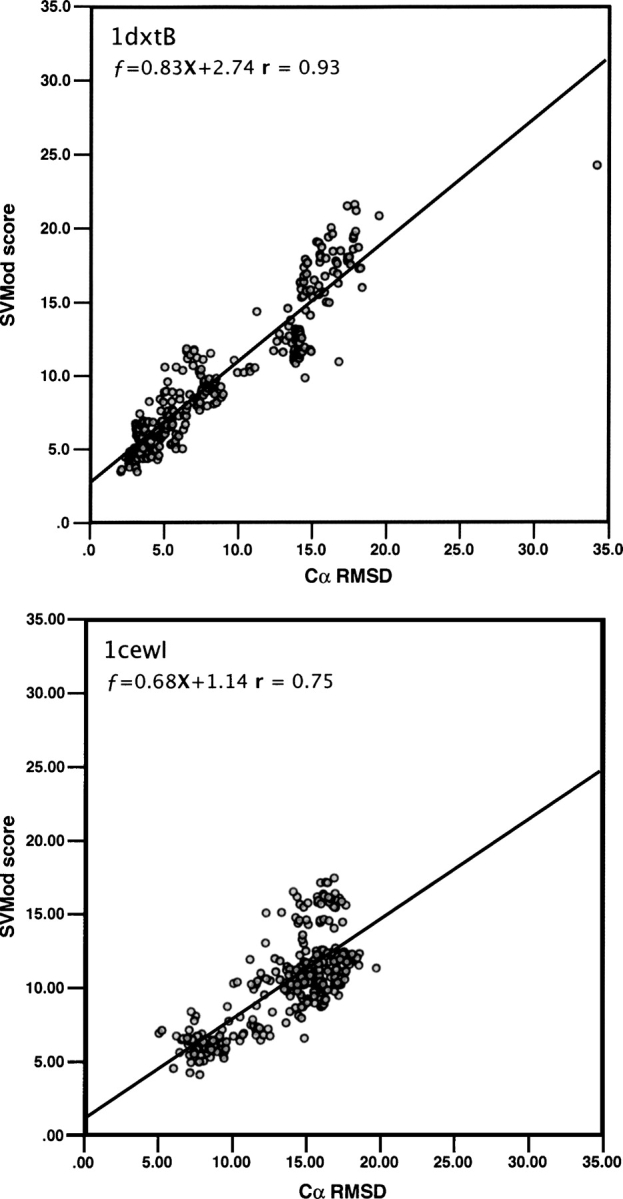
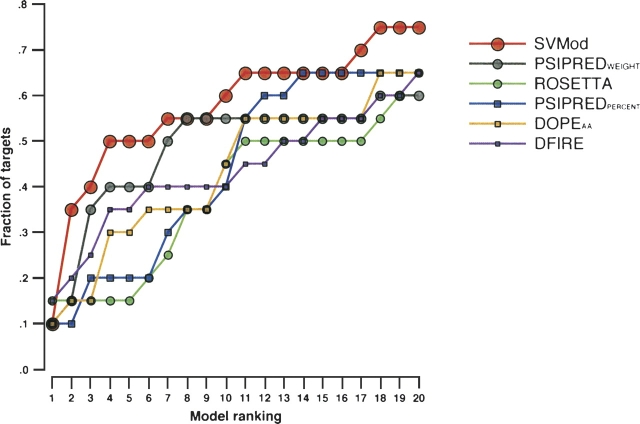
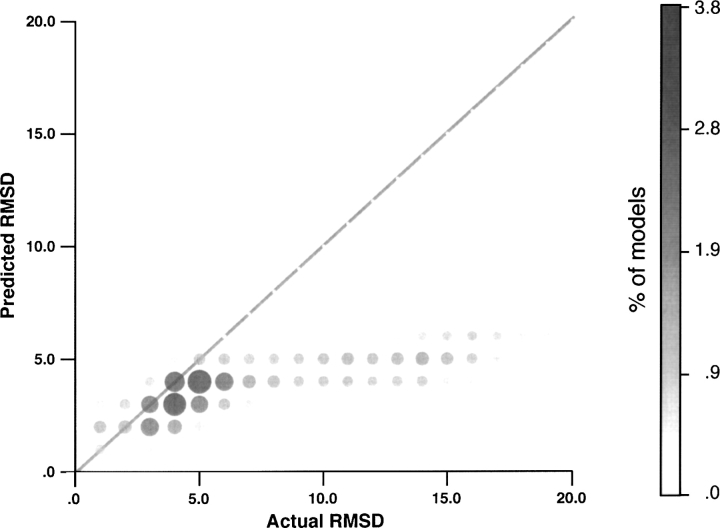
Reliable prediction of model accuracy is an important unsolved problem in protein structure modeling. To address this problem, we studied 24 individual assessment scores, including physics-based energy functions, statistical potentials, and machine learning-based scoring functions. Individual scores were also used to construct approximately 85,000 composite scoring functions using support vector machine (SVM) regression. The scores were tested for their abilities to identify the most native-like models from a set of 6000 comparative models of 20 representative protein structures. Each of the 20 targets was modeled using a template of <30% sequence identity, corresponding to challenging comparative modeling cases. The best SVM score outperformed all individual scores by decreasing the average RMSD difference between the model identified as the best of the set and the model with the lowest RMSD (DeltaRMSD) from 0.63 A to 0.45 A, while having a higher Pearson correlation coefficient to RMSD (r=0.87) than any other tested score. The most accurate score is based on a combination of the DOPE non-hydrogen atom statistical potential; surface, contact, and combined statistical potentials from MODPIPE; and two PSIPRED/DSSP scores. It was implemented in the SVMod program, which can now be applied to select the final model in various modeling problems, including fold assignment, target-template alignment, and loop modeling.


Figures

Figure 1.
Figure 1.
Comparison of accuracies (ΔRMSD) of the individual assessment scores. (Upper diagonal) Gray and white squares indicate pairs of methods whose performance are and are not statistically significantly different at the confidence level of 95%, respectively. (Lower diagonal) The intensity of gray is proportional to the ΔRMSD between the compared methods.
Figure 2.
Figure 2.
Weighted pair-group average clustering based on a pairwise correlation distance matrix. The image was generated by the Phylodendron Web server (http://iubio.bio.indiana.edu/treeapp/). Their physical distance represents the difference in the pairwise correlation between any two methods, with one distance unit corresponding to a difference of 0.1 from perfect correlation (r = 1.0).
Figure 3.
Figure 3.
Comparison of accuracies (ΔRMSD) of the assessment scores used to develop the SVMod score. (Upper diagonal) Gray and white squares indicate pairs of methods whose performance are and are not statistically significantly different at the confidence level of 95%, respectively. (Lower diagonal) The intensity of gray in each box is proportional to the pairwise ΔRMSD between the scores listed on the axes (absolute differences indicated).
Figure 4.
Figure 4.
Cα RMSD correlation with the SVMod score for 300 models for the targets with the best (1dxtB, upper panel) and worst (1cewI, lower panel) correlations, at r = 0.93 and 0.75, respectively.
Figure 5.
Figure 5.
Enrichment factor defined as the fraction of the 20 targets for which a method was able to select the best model within the N best-ranked models.
Figure 6.
Figure 6.
Histogram of the Cα RMSD and SVMod score (predicted RMSD) distributions for the MODPIPE set of 80,593 models. RMSD measures were grouped in bins of 1 Å, with the size of each bin indicated by both the intensity and the area of the circle.

References

    1. Adamczak R., Porollo A., Meller J. 2004. Accurate prediction of solvent accessibility using neural networks-based regression. Proteins 56: 753–767. - PubMed
    1. Andreeva A., Howorth D., Brenner S.E., Hubbard T.J., Chothia C., Murzin A.G. 2004. SCOP database in 2004: Refinements integrate structure and sequence family data. Nucleic Acids Res. 32: D226–D229. - PMC - PubMed
    1. Apweiler R., Bairoch A., Wu C.H., Barker W.C., Boeckmann B., Ferro S., Gasteiger E., Huang H., Lopez R., Magrane M.et al. 2004. UniProt: The Universal Protein knowledge base. Nucleic Acids Res. 32: D115–D119. - PMC - PubMed
    1. Bairoch A., Apweiler R., Wu C.H., Barker W.C., Boeckmann B., Ferro S., Gasteiger E., Huang H., Lopez R., Magrane M.et al. 2005. The Universal Protein Resource (UniProt). Nucleic Acids Res. 33: D154–D159. - PMC - PubMed
    1. Baker D. and Sali A. 2001. Protein structure prediction and structural genomics. Science 294: 93–96. - PubMed

Publication types

LinkOut - more resources