Comparative Study
. 2006 Aug;173(4):1835-50.
doi: 10.1534/genetics.106.058990. Epub 2006 Jun 4.

Long-term evolution and functional diversification in the members of the nucleophosmin/nucleoplasmin family of nuclear chaperones

Affiliations
Comparative Study

Long-term evolution and functional diversification in the members of the nucleophosmin/nucleoplasmin family of nuclear chaperones

José M Eirín-López et al. Genetics. 2006 Aug.

Abstract

The proper assembly of basic proteins with nucleic acids is a reaction that must be facilitated to prevent protein aggregation and formation of nonspecific nucleoprotein complexes. The proteins that mediate this orderly protein assembly are generally termed molecular (or nuclear) chaperones. The nucleophosmin/nucleoplasmin (NPM) family of molecular chaperones encompasses members ubiquitously expressed in many somatic tissues (NPM1 and -3) or specific to oocytes and eggs (NPM2). The study of this family of molecular chaperones has experienced a renewed interest in the past few years. However, there is a lack of information regarding the molecular evolution of these proteins. This work represents the first attempt to characterize the long-term evolution followed by the members of this family. Our analysis shows that there is extensive silent divergence at the nucleotide level suggesting that this family has been subject to strong purifying selection at the protein level. In contrast to NPM1 and NPM-like proteins in invertebrates, NPM2 and NPM3 have a polyphyletic origin. Furthermore, the presence of selection for high frequencies of acidic residues as well as the existence of higher levels of codon bias was detected at the C-terminal ends, which can be ascribed to the critical role played by these residues in constituting the acidic tracts and to the preferred codon usage for phosphorylatable amino acids at these regions.


Figures

F<sc>igure</sc> 1.—
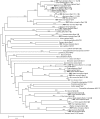
Figure 1.—
Phylogenetic relationships among NPM proteins. The reconstruction was carried out by calculating the evolutionary amino acid p-distances from the NPM sequences of all the organisms analyzed (see supplemental Table 1 at http://www.genetics.org/supplemental/). NPM types are indicated on the right near the species names and the number of sequences analyzed is indicated within parentheses. Numbers for interior nodes indicate BP (boldface type) and CP (lightface type) confidence values. The numbers in black boxes indicate the bootstrap values obtained in the reconstruction of the maximum parsimony trees, carried out using all the informative positions in the alignment, by the close-neighbor-interchange (CNI) search method with search level 1 and with 10 replications for the random addition trees option. Confidence values were based on 1000 replications, and are only shown when the value is >50%. The differentiation and diversification events indicated by squares and circles at the nodes in the phylogeny are summarized in the upper part of the figure. The asterisk (*) denotes the only exception to the functional clustering of NPM proteins exhibited by Xenopus NPM3 and Danio rerio NPM3. Nonredundant sequences are indicated in the tree with the prefix NR.
F<sc>igure</sc> 2.—
Figure 2.—
Phylogenetic neighbor-joining tree of NPM complete nucleotide-coding sequences. The reconstruction was performed by using the number of synonymous nucleotide differences per site (pS) estimated by the modified Nei–Gojobori method (p-distance). The NPM types, number of sequences, redundance, and BP and CP confidence values are indicated as in Figure 1. The NPM3 pseudogenes from mouse are referred as Ψ.
F<sc>igure</sc> 3.—
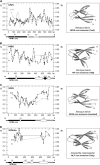
Figure 3.—
Total (π) and synonymous (πS) nucleotide diversity (expressed as the average number of nucleotide difference per site) across the coding regions of NPM1 (A), NPM2 (B), NPM3 (C), and NPM-like from invertebrates (D). The diversity values were calculated using a sliding-window approach with a window length of 20 bp and a step size of 5 bp (for π) and a window length of 10 bp and a step size of 5 bp (for πS). The corresponding secondary structure, as well as the tertiary structure, of each NPM type is represented below and on the right of the corresponding graph, respectively. In the NPM secondary structures, the core regions are indicated by solid boxes, the C-terminal segments by shaded boxes, the acidic tracts by open boxes, and the nuclear localization signal (NLS) by a solid circle.
F<sc>igure</sc> 4.—
Figure 4.—
Amino acid alignments corresponding to the C-terminal segment of NPM1, NPM2, and NPM3 in different representative species showing the characteristic acidic tracts (solid boxes).
F<sc>igure</sc> 5.—
Figure 5.—
Relationship between GC content and the frequencies of GC-rich (GAPW) and GC-poor (FYMINK) amino acid classes in NPM1 (A), NPM2 (B), and NPM3 (C) discriminating between the complete proteins, the N-terminal domains, and the C-terminal domains.
F<sc>igure</sc> 6.—
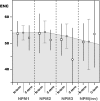
Figure 6.—
Codon usage bias in NPM genes. The effective number of codons (ENC) was calculated for complete NPM genes (solid circles) and discriminating between the N-terminal (open boxes) and the C-terminal (open circles) structural domains. Values are given as averages and standard deviations are represented by bars.
F<sc>igure</sc> 7.—
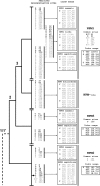
Figure 7.—
Predicted phosphorylation sites in NPM proteins. The potential phosphorylation sites at serine (S), threonine (T), and tyrosine (Y) residues (threshold >0.5) were predicted and the corresponding codon usage at these positions for NPM proteins in different taxonomic groups residues was calculated (see supplemental alignments 1–4 at http://www.genetics.org/supplemental/). Common sites indicate those positions predicted to be phosphorylated in all species within a given NPM subtype. Sites shown in boldface type highlight positions located at N-terminal regions of the molecules. The Y128 position in NPM2, whose dephosphorylation has recently been linked to chromatin condensation during apoptosis in Xenopus (Lu et al. 2005), is indicated by an arrow. The branching pattern and the numbering of the nodes at the left denote the evolutionary relationships among NPM proteins described in Figure 1.

References

    1. Arnan, C., N. Saperas, C. Prieto, M. Chiva and J. Ausió, 2003. Interaction of nucleoplasmin with core histones. J. Biol. Chem. 278: 31319–31324. - PubMed
    1. Bañuelos, S., A. Hierro, J. M. Arizmendi, G. Montoya, A. Prado et al., 2003. Activation mechanism of the nuclear chaperone nucleoplasmin: role of the core domain. J. Mol. Biol. 334: 585–593. - PubMed
    1. Blom, N., S. Gammeltoft and S. Brunak, 1999. Sequence- and structure-based prediction of eukaryotic protein phosphorylation sites. J. Mol. Biol. 294: 1351–1362. - PubMed
    1. Borer, R. A., C. F. Lehner, H. M. Eppenberger and E. A. Nigg, 1989. Major nucleolar proteins shuttle between nucleus and cytoplasm. Cell 56: 379–390. - PubMed
    1. Burns, K. H., M. M. Viveiros, Y. Ren, P. Wang, F. J. DeMayo et al., 2003. Roles of NPM2 in chromatin and nucleolar organization in oocytes and embryos. Science 300: 633–636. - PubMed

Publication types

MeSH terms