Comparative Study
. 2006 Aug;173(4):2165-77.
doi: 10.1534/genetics.106.055715. Epub 2006 Jun 4.

Scan of human genome reveals no new Loci under ancient balancing selection

Affiliations
Comparative Study

Scan of human genome reveals no new Loci under ancient balancing selection

K L Bubb et al. Genetics. 2006 Aug.

Abstract

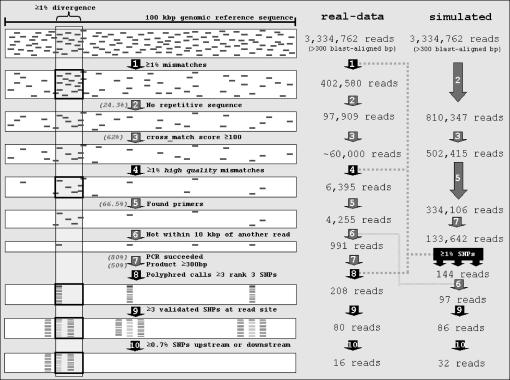
There has been much speculation as to what role balancing selection has played in evolution. In an attempt to identify regions, such as HLA, at which polymorphism has been maintained in the human population for millions of years, we scanned the human genome for regions of high SNP density. We found 16 regions that, outside of HLA and ABO, are the most highly polymorphic regions yet described; however, evidence for balancing selection at these sites is notably lacking--indeed, whole-genome simulations indicate that our findings are expected under neutrality. We propose that (i) because it is rarely stable, long-term balancing selection is an evolutionary oddity, and (ii) when a balanced polymorphism is ancient in origin, the requirements for detection by means of SNP data alone will rarely be met.


Figures

F<sc>igure</sc> 1.—
Figure 1.—
Analysis pipelines used to identify regions of the genome with high polymorphism in real and simulated data. Numbers shown for the simulated pipeline are those generated using a parameter-rich coalescent model (Schaffner et al. 2005). Black arrows indicate steps that enrich for highly polymorphic regions, indicated by black boxes following these steps. Gray arrows are accompanied by the percentage of reads that passes through that particular filter. That value is used in the simulated pipeline. As is described more fully in materials and methods, the order of the filters differed between the real-data and simulated pipelines.
F<sc>igure</sc> 2.—
Figure 2.—
Key filtering techniques used to find extended regions of high polymorphism: (a) original alignment of the SNP Consortium read (“TSC read”) to the human reference genome; (b) the SNP-confirmation step in which the region was amplified from the genomic DNA of 10 self-identified African Americans and resequenced (20 haplotypes); and (c) the SNP discovery step 3 kbp upstream and downstream from the original read, based on a panel including three of the previous African Americans (haplotypes indicated with shaded lines) and four additional individuals from a diversity panel (haplotypes indicated with dashed shaded lines). Note that SNPs were not typed for the four additional individuals at the site of the original read alignment. For each SNP, the major and minor alleles are indicated as solid and open circles, respectively. Asterisks indicate potential “tag” SNPs used in the subsequent fosmid isolation step.
F<sc>igure</sc> 3.—
Figure 3.—
Pairwise divergences in 5-kbp sliding windows (offset = 100 bp) over a 30-kbp genomic span for three loci. Blue lines indicate human–human comparisons; red lines indicate human–chimpanzee comparisons. At the top, middle, and bottom, dotted lines represent pairwise divergences of 1, 0.3, and 0.081%. The latter value is the genomewide average divergence between two randomly sampled sequences. Straight edges indicate interpolation of the human–chimpanzee comparisons across regions in which chimpanzee sequence is lacking.
F<sc>igure</sc> 4.—
Figure 4.—
Description of simulation and three alternate methods of analysis. (Top) The evolutionary relationship among 30 haplotypes of a population for a segment of genomic sequence. For those 30 haplotypes, there are two changes in their evolutionary relationship in this segment, due to ancestral recombination events. The sites of these ancestral recombinations are represented by edges between adjacent color blocks, which contain slightly differing phylogenies. (Bottom) Three alternate methods of analyzing the simulated genomes. (a) The number of nucleotide differences between the most dissimilar haplotypes (MAXDIV) within each nonoverlapping 5-kbp window is reported. (b) For each nonoverlapping 20-kbp window, the MAXDIV of the most divergent 5-kbp window is reported. (c) For each 20-kbp window that satisfied the computational filtering requirements summarized in Figure 1, the MAXDIV of the most divergent 5-kbp window is reported (see materials and methods for details). To simulate the filtering steps, three test regions (see small vertical boxes) were established in the center of each 20-kbp window, corresponding to the positions of the original read and sites 3 kbp upstream and downstream from this position.
F<sc>igure</sc> 5.—
Figure 5.—
Comparison of observed loci with simulated MAXDIV distributions. Curves labeled methods a–c were generated by analyzing data simulated under the simple coalescent model, using the analysis methods illustrated in Figure 4. The curve labeled “parameter-rich” was generated by analyzing data simulated under the parameter-rich coalescent model using method c. See materials and methods for details of both simulation models and analysis methods. For each analysis method, a histogram was produced and then normalized such that the bar areas sum to one. Red asterisks indicate the MAXDIV of the 16 loci for which we obtained extended sequence. The smoothness of the curve for method a reflects a higher number of windows analyzed in the 10 genomes with this method.
F<sc>igure</sc> 6.—
Figure 6.—
The effect of varying recombination rates (rho) on simulated MAXDIV distributions. All distributions were generated using method c. The curves for different multiples of rho (where rho = 5 × 10⁻⁴) used data simulated under the simple model. The curve labeled “parameter-rich” was generated by analyzing data simulated under the parameter-rich coalescent model. Red asterisks indicate the MAXDIV of the 16 loci for which we obtained extended sequence.
F<sc>igure</sc> 7.—
Figure 7.—
Numbers of 20-kbp windows found per simulated genome for simple coalescent models with varying recombination rates and the parameter-rich coalescent model. The line of shaded asterisks indicates the number of 20-kbp windows identified in our real-data screen. The line of shaded circles indicates the number of 20-kbp windows found per simulated genome for the parameter-rich model. Analyses used method c, illustrated in Figure 4.
F<sc>igure</sc> 8.—
Figure 8.—
Sites within the HLA locus that our computational filter indicated as putative highly polymorphic. The profile of the pairwise divergence for 10-kbp sliding windows with 5-kbp offsets of two HLA haplotypes, 6-COX and PGF (Stewart et al. 2004), is plotted, with select HLA genes and our hits indicated by black vertical lines above the scale bar.

References

    1. Akey, J. M., G. Zhang, K. Zhang, L. Jin and M. D. Shriver, 2002. Interrogating a high-density SNP map for signatures of natural selection. Genome Res. 12: 1805–1814. - PMC - PubMed
    1. Altschul, S. F., W. Gish, W. Miller, E. W. Myers and D. J. Lipman, 1990. Basic local alignment search tool. J. Mol. Biol. 215: 403–410. - PubMed
    1. Asthana, S., S. Schmidt and S. Sunyaev, 2005. A limited role for balancing selection. Trends Genet. 21: 30–32. - PubMed
    1. Barton, N. H., and A. Navarro, 2002. Extending the coalescent to multilocus systems: the case of balancing selection. Genet. Res. 79: 129–139. - PubMed
    1. Bird, A. P., 1980. DNA methylation and the frequency of CpG in animal DNA. Nucleic Acids Res. 8: 1499–1504. - PMC - PubMed

Publication types