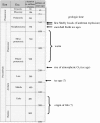
Palaeoclimates: the first two billion years
- PMID: 16754607
- PMCID: PMC1868609
- DOI: 10.1098/rstb.2006.1839
Palaeoclimates: the first two billion years
Abstract
Earth's climate during the Archaean remains highly uncertain, as the relevant geologic evidence is sparse and occasionally contradictory. Oxygen isotopes in cherts suggest that between 3.5 and 3.2 Gyr ago (Ga) the Archaean climate was hot (55-85 degrees C); however, the fact that these cherts have experienced only a modest amount of weathering suggests that the climate was temperate, as today. The presence of diamictites in the Pongola Supergroup and the Witwatersrand Basin of South Africa suggests that by 2.9 Ga the climate was glacial. The Late Archaean was relatively warm; then glaciation (possibly of global extent) reappeared in the Early Palaeoproterozoic, around 2.3-2.4 Ga. Fitting these climatic constraints with a model requires high concentrations of atmospheric CO2 or CH4, or both. Solar luminosity was 20-25% lower than today, so elevated greenhouse gas concentrations were needed just to keep the mean surface temperature above freezing. A rise in O2 at approximately 2.4 Ga, and a concomitant decrease in CH4, provides a natural explanation for the Palaeoproterozoic glaciations. The Mid-Archaean glaciations may have been caused by a drawdown in H2 and CH4 caused by the origin of bacterial sulphate reduction. More work is needed to test this latter hypothesis.
Figures


References
-
- Bau M, Romer R.L, Lüders V, Beukes N.J. Pb, O, and C isotopes in silicified Mooidraai dolomite (Transvaal Supergroup, South Africa): implications for the composition of Paleoproterozoic seawater and ‘dating’ the increase in oxygen in the Precambrian atmosphere. Earth Planet. Sci. Lett. 1999;174:43–57. 10.1016/S0012-821X(99)00261-7 - DOI
-
- Bekker A, Kaufman A.J, Karhu J.A, Beukes N.J, Swart Q.D, Coetzee L.L, Eriksson K.A. Chemostratigraphy of the Paleoproterozoic Duitschland Formation, South Africa: implications for coupled climate change and carbon cycling. Am. J. Sci. 2001;301:261–285.
-
- Bekker A, Holland H.D, Wang P.-L, Rumble D.I, Stein H.J, Hannah J.L, Coetzee L.L, Beukes N.J. Dating the rise of atmospheric oxygen. Nature. 2004;427:117–120. 10.1038/nature02260 - DOI - PubMed
-
- Berner R.A. The Phanerozoic carbon cycle: CO2 and O2. Oxford University Press; Oxford: 2004.
-
- Berner R.A, Lasaga A.C, Garrels R.M. The carbonate–silicate geochemical cycle and its effect on atmospheric carbon dioxide over the past 100 million years. Am. J. Sci. 1983;283:641–683. - PubMed
Publication types
MeSH terms
Substances
LinkOut - more resources
Full Text Sources
