Review
. 2006 Jun 29;361(1470):1039-54.
doi: 10.1098/rstb.2006.1845.

The origin and diversification of eukaryotes: problems with molecular phylogenetics and molecular clock estimation

Affiliations
Review

The origin and diversification of eukaryotes: problems with molecular phylogenetics and molecular clock estimation

Andrew J Roger et al. Philos Trans R Soc Lond B Biol Sci. .

Abstract

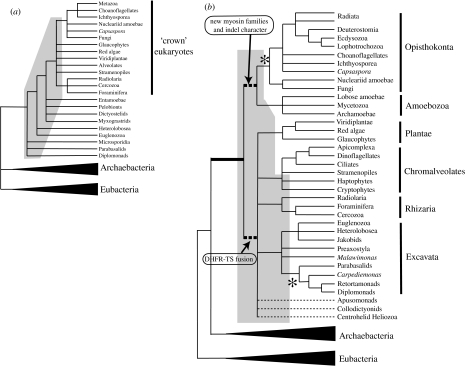
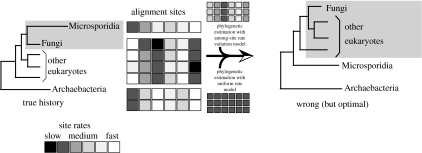
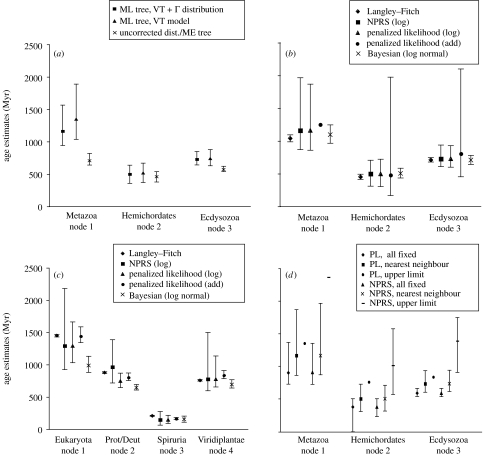
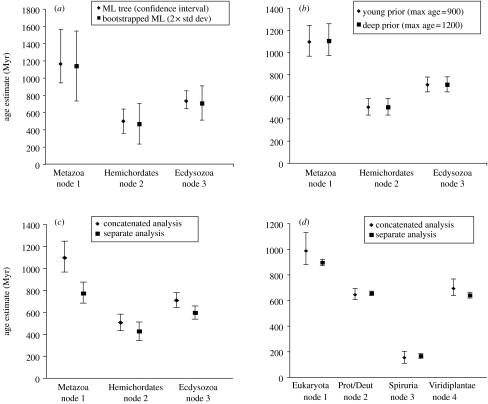
Determining the relationships among and divergence times for the major eukaryotic lineages remains one of the most important and controversial outstanding problems in evolutionary biology. The sequencing and phylogenetic analyses of ribosomal RNA (rRNA) genes led to the first nearly comprehensive phylogenies of eukaryotes in the late 1980s, and supported a view where cellular complexity was acquired during the divergence of extant unicellular eukaryote lineages. More recently, however, refinements in analytical methods coupled with the availability of many additional genes for phylogenetic analysis showed that much of the deep structure of early rRNA trees was artefactual. Recent phylogenetic analyses of a multiple genes and the discovery of important molecular and ultrastructural phylogenetic characters have resolved eukaryotic diversity into six major hypothetical groups. Yet relationships among these groups remain poorly understood because of saturation of sequence changes on the billion-year time-scale, possible rapid radiations of major lineages, phylogenetic artefacts and endosymbiotic or lateral gene transfer among eukaryotes. Estimating the divergence dates between the major eukaryote lineages using molecular analyses is even more difficult than phylogenetic estimation. Error in such analyses comes from a myriad of sources including: (i) calibration fossil dates, (ii) the assumed phylogenetic tree, (iii) the nucleotide or amino acid substitution model, (iv) substitution number (branch length) estimates, (v) the model of how rates of evolution change over the tree, (vi) error inherent in the time estimates for a given model and (vii) how multiple gene data are treated. By reanalysing datasets from recently published molecular clock studies, we show that when errors from these various sources are properly accounted for, the confidence intervals on inferred dates can be very large. Furthermore, estimated dates of divergence vary hugely depending on the methods used and their assumptions. Accurate dating of divergence times among the major eukaryote lineages will require a robust tree of eukaryotes, a much richer Proterozoic fossil record of microbial eukaryotes assignable to extant groups for calibration, more sophisticated relaxed molecular clock methods and many more genes sampled from the full diversity of microbial eukaryotes.


Figures

Figure 1
Figure 1
Alternative views of the tree of eukaryotes. (a) The topology typically recovered in rRNA phylogenies in the 1990s (Sogin 1991; Cavalier-Smith & Chao 1996). Multifurcations indicate poorly supported branches or different branching orders depending on the taxonomic sampling. The grey-shaded region of the tree indicates the part of the rRNA tree that is likely artefactual, resulting from long-branch attraction (LBA). Note that the late-branching position of the Foraminifera is shown as recovered in later rRNA analyses (Nikolaev et al. 2004). (b) A hypothetical phylogeny indicating the six major supergroups of eukaryotes (see Simpson & Roger (2004) and Keeling et al. (2005) for recent reviews). Dotted branches indicate lineages that do not clearly fall within any of the major groups. The placement of the root of the tree of eukaryotes is indicated by dihydrofolate reductase (DHFR)–thymidylate synthase (TS) fusion data (Stechmann & Cavalier-Smith 2002) and myosin gene family data (Richards & Cavalier-Smith 2005). Alternative positions for the root (Arisue et al. 2005) are indicated by asterisks. The grey shaded region depicts the parts of this hypothetical tree of eukaryotes that are not strongly recovered (with greater than 85% bootstrap support) in published single or multiple gene phylogenies (e.g. Hampl et al. 2005; Simpson et al. 2006).
Figure 2
Figure 2
Changing among-site rate variation (ASRV) distributions in EF-1α homologues cause Microsporidia to artefactually branch at the base of eukaryotes (Inagaki et al. 2004). The ASRV distribution (indicated by shaded boxes) of microsporidian sequences is more similar to the archaebacterial sequences, possibly because of parallel loss of constraints at sites that are functionally conserved in other eukaryotes. Under these conditions, phylogenetic methods that assume equal rates at sites or a simple ASRV distribution artefactually recover the Microsporidia as branching basally to other eukaryotes, grouping with the archaebacterial outgroup.
Figure 3
Figure 3
Assumed topologies for molecular clock studies. (a) Topology used by Peterson–Butterfield (PB) in their analyses (Peterson & Butterfield 2005). (b) Topology from the Douzery (DZ) dataset (Douzery et al. 2004). The nodes under examination in the current study are labelled by the large numbers. Boxed numbers indicate fossil dated (in millions of years) constrained nodes taken from the original studies.
Figure 4
Figure 4
(a) Variation in age estimates and confidence intervals for the PB dataset under differing models of substitution. The trees and branch lengths were optimized by ML using Tree-Puzzle 5.2 (Schmidt et al. 2002) under the VT model (Müller et al. 2002) assuming equal rates or assuming a gamma distribution for ASRV (VT+Γ), or in PAUP* (Swofford 2000) using uncorrected distances and minimum evolution (ME). Age estimates and confidence intervals were generated using r8s (Sanderson 2003) under penalized likelihood (PL) with a logarithmic penalty with cross-validation optimization of the penalty coefficient. (b) Variation in age estimates under different molecular clock methods for the PB dataset. (c) Variation in age estimates under different molecular clock methods for the DZ dataset. Age estimates were generated for LF, NPRS and PL models in r8s using a tree with ML branch lengths using the VT+Γ model for the PB dataset and the Whelan and Goldman plus gamma (WAG+Γ) model (Whelan & Goldman 2001) for the DZ dataset. Bayesian estimates were generated using EST branches and Multidivtime5b (Kishino et al. 2001). (d) The effect of different schemes for constraining fossil dates on age estimates and confidence intervals. The branch lengths used were generated by ML with the VT+Γ model. Ages were generated in r8s employing either the NPRS or PL methods with a logarithmic penalty. Constraint models were either (i) all nodes fixed to the corresponding fossil date (‘all fixed’), (ii) nodes set with fossil dates as a minimum age and 1500 Myr as a maximum (‘upper limit’) or (iii) nodes set with their fossil dates as a minimum age and the corresponding fossil dates of the parent node age as a maximum (‘nearest-neighbour’). Cross-validation optimization of the PL penalty coefficient was not employed for analyses shown in (b), (c) and (d).
Figure 5
Figure 5
(a) Effect of bootstrapping on confidence intervals under penalized likelihood with a logarithmic penalty with cross-validation optimization of the penalty coefficient. 100 bootstraps of the PB dataset ML tree were generated using Puzzleboot (http://www.tree-puzzle.de) and Tree-Puzzle 5.2. In r8s, confidence intervals were generated for the single tree and the 100 bootstraps. Standard deviations from the bootstrapped trees were also obtained for the nodes of interest. (b) Effect of different priors under Bayesian analysis with Multidivtime5b. Two different prior distributions centred around two different root-to-tip age estimates were used and the posterior mean age estimates for nodes and their 95% credible intervals are shown. (c,d) Age estimates for datasets treated as a single large concatenate of genes or as ‘separate’ loci (Thorne & Kishino 2002). Estimates and 95% credible intervals for the PB dataset (c) and the DZ dataset (d) under these conditions are shown.

References

    1. Andersson J.O. Lateral gene transfer in eukaryotes. Cell. Mol. Life Sci. 2005;62:1182–1197. 10.1007/s00018-005-4539-z - DOI - PMC - PubMed
    1. Andersson J.O, Sarchfield S.W, Roger A.J. Gene transfers from Nanoarchaeota to an ancestor of diplomonads and parabasalids. Mol. Biol. Evol. 2005;22:85–90. 10.1093/molbev/msh254 - DOI - PubMed
    1. Aravind L, Koonin E.V. Eukaryotic-specific domains in translation initiation factors: implications for translation regulation and evolution of the translation system. Genome Res. 2000;10:1172–1184. 10.1101/gr.10.8.1172 - DOI - PMC - PubMed
    1. Archibald J.M. Jumping genes and shrinking genomes—probing the evolution of eukaryotic photosynthesis with genomics. IUBMB Life. 2005;57:539–547. - PubMed
    1. Archibald J.M, Longet D, Pawlowski J, Keeling P.J. A novel polyubiquitin structure in Cercozoa and Foraminifera: evidence for a new eukaryotic supergroup. Mol. Biol. Evol. 2003;20:62–66. 10.1093/molbev/msg006 - DOI - PubMed

Publication types

LinkOut - more resources