. 2006 Jun 13;103(24):9327-32.
doi: 10.1073/pnas.0603601103. Epub 2006 Jun 5.

The mouse Clock mutation reduces circadian pacemaker amplitude and enhances efficacy of resetting stimuli and phase-response curve amplitude

Affiliations

The mouse Clock mutation reduces circadian pacemaker amplitude and enhances efficacy of resetting stimuli and phase-response curve amplitude

Martha Hotz Vitaterna et al. Proc Natl Acad Sci U S A. .

Abstract

The mouse Clock gene encodes a basic helix-loop-helix-PAS transcription factor, CLOCK, that acts in concert with BMAL1 to form the positive elements of the circadian clock mechanism in mammals. The original Clock mutant allele is a dominant negative (antimorphic) mutation that deletes exon 19 and causes an internal deletion of 51 aa in the C-terminal activation domain of the CLOCK protein. Here we report that heterozygous Clock/+ mice exhibit high-amplitude phase-resetting responses to 6-h light pulses (Type 0 resetting) as compared with wild-type mice that have low amplitude (Type 1) phase resetting. The magnitude and time course of acute light induction in the suprachiasmatic nuclei of the only known light-induced core clock genes, Per1 and Per2, are not affected by the Clock/+ mutation. However, the amplitude of the circadian rhythms of Per gene expression are significantly reduced in Clock homozygous and heterozygous mutants. Rhythms of PER2::LUCIFERASE expression in suprachiasmatic nuclei explant cultures also are reduced in amplitude in Clock heterozygotes. The phase-response curves to changes in culture medium are Type 0 in Clock heterozygotes, but Type 1 in wild types, similar to that seen for light in vivo. The increased efficacy of resetting stimuli and decreased PER expression amplitude can be explained in a unified manner by a model in which the Clock mutation reduces circadian pacemaker amplitude in the suprachiasmatic nuclei.


Conflict of interest statement

Conflict of interest statement: No conflicts declared.

Figures
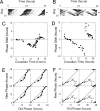
Fig. 1.
Fig. 1.
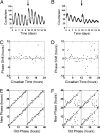
Phase-shifting responses to light pulses in the circadian activity rhythms of C57BL/6J wild-type and Clock/+ mice. (A and B) Activity records of wild-type (A) and Clock/+ (B) mice given a 6-h light pulse at CT17. The arrow on the right margin indicates the day when the light pulse was given. Records are double-plotted so that 48 h are shown on each horizontal trace with a 24-h day presented beneath and to the right of the preceding day. Times of activity are indicated by dark regions. (C and D) Phase–response curve to 6-h light pulses in wild-type (n = 61) (C) and Clock/+ (n = 58) (D) mice. The x axis indicates the CT at the beginning of the light pulse. The y axis indicates the phase shift produced by the light pulse. (E and F) Phase–transition curve to the light pulses in wild-type (E) and Clock/+ (F) mice. Data from C and D are replotted so that the x axis indicates the phase (CT) at the beginning of the light pulse as determined from the preceding free run. The y axis indicates the extrapolated phase (CT) of the light pulse calculated from the reset rhythm.
Fig. 2.
Fig. 2.
Circadian rhythms of Per1 mRNA expression in the SCN. Time course of Per1 expression in the SCN of wild-type (●) and Clock/Clock (○) mice. Samples were collected every 4 h during the last cycle in LD and first 4 cycles of free run in constant darkness (DD). Lighting conditions are indicated by the bar at the bottom. Because data were collected in two replicate experiments, values were normalized to the wild-type mean levels. In addition, the induction by a 1-h light pulse at Zeitgeber Time (ZT) 17 are shown by the square symbols at the left. See Fig. 10 for representative images of peak and trough of Per1 in situ images.
Fig. 3.
Fig. 3.
Effects of light–pulse duration on the behavioral response (phase shifts) and induction of Per1 and Per2 in the SCN of C57BL/6J coisogenic mice. (A) Behavioral phase shifts (in circadian hours) as a function of light–pulse duration for wild-type (●) and Clock/+ (○) mice. Phase shifts were determined after 15, 30, 60, 180, and 360 min of light exposure that started at CT 17. Clock/+ mice exhibited significantly greater phase shifts than wild types (Tukey–Kramer; P < 0.05) in response to 180 and 360 min light pulses. (B and C) Relative Per1 (B) and Per2 (C) mRNA expression in the SCN of wild-type (● and ○) and Clock/+ (■ and □) mice. Samples were collected at CT 17 or after 60, 180, or 360 min of light exposure beginning at CT 17 (filled symbols). Dark-maintained controls also were sampled at 60, 180, or 360 min after CT 17 (open symbols). Overall, the induction of Per1 and Per2 genes to increase in light–pulse duration did not differ between the genotypes (no significant genotype effect by ANOVA. Per1: F1,44 = 0.78, P > 0.05 and Per2 F1,32 = 0.01; P > 0.05). There is significant light induction of both genes (Per1: F1,44 = 135.65; P < 0.001 and Per2: F1,32 = 89.23; P < 0.001) as well as a significant effect of light pulse duration on induction (Per1: F3,44 = 68.38; P < 0.001 and Per2: F3,32 = 3.96; P < 0.05). For Per1 expression, light-exposed levels are different from dark control levels at 60 and 180 min (Tukey–Kramer; P < 0.05). For Per2 expression, light-exposed levels are different from dark control levels at 60, 180, and 360 min (Tukey–Kramer; P < 0.05). (D and E) Circadian rhythms of Per1 (D) and Per2 (E) mRNA expression in the SCN of wild-type (●) and Clock/+ (○) mice after 3 weeks in constant darkness. The amplitude of circadian rhythms in both Per1 and Per2 genes are significantly reduced in Clock/+ mice (Per1: F1,71 = 0.6.71; P < 0.05 and Per2 F1,71 = 5.40; P < 0.05). For both Per1 and Per2, there were significant differences between CTs (Per1: F5,71 = 8.80; P < 0.001 and Per2: F5,71 = 46.85; P < 0.001). For Per1, levels are significantly lower at CT18 than CTs 2, 6 and 10, and significantly higher at CT 6 than CTs 14, 18, and 22 (Tukey–Kramer; P < 0.05). For Per2, levels are significantly higher at CT10 than all other times, and CTs 6, 10, and 14 are significantly higher than CTs 18, 22, and 2 (Tukey–Kramer; P < 0.05).
Fig. 4.
Fig. 4.
Circadian rhythms of PER2::LUCIFERASE in SCN explants in response to medium change. (A) Representative bioluminescence rhythm in an SCN explant from PER2::LUC-wild-type mice. In this record, a medium change was administered at CT8 that resulted in no phase shift. The arrow indicates when the medium change occurred. (B) Representative bioluminescence rhythm in an SCN explant from PER2::LUC-Clock/+ mice. In this record, medium change was administered at CT10 that resulted in ≈2-h phase delay. (C and D) Phase–response curve to medium changes in SCN explants from PER2::LUC-wild-type (n = 43) (C) and PER2::LUC-Clock/+ (n = 51) (D) mice. The x axis indicates the CT when the medium changes occurred as determined from the preceding free-running period of PER2::LUC bioluminescence, with the peak of the rhythm defined as CT12. The y axis indicates the phase shift (in hours) produced by the medium change. (E and F) Phase–transition curve to the medium changes in SCN explants from PER2::LUC-wild-type (E) and PER2::LUC-Clock/+ (F) mice. Data from C and D are replotted so that the x axis indicates the old phase (CT) when the medium change occurred as determined from the preceding free-running period of the bioluminescence. The y axis indicates the new phase (CT) of the medium change calculated from the reset rhythm.
Fig. 5.
Fig. 5.
Limit-cycle model of the circadian pacemaker. (A) A 2D limit cycle oscillator is represented diagrammatically by a circle that represents the steady-state path of the oscillatory system. In this rendition, time moves clockwise around the circle, and four phase points are indicated by the radial lines that represent “isochrons,” or sets of points with equivalent phase (26). The singularity, which is an unstable equilibrium point, is indicated by the black dot at the intersection of the isochrons. The blue vectors represent the perturbations caused by light pulses. During the perturbation, the system is carried off the limit cycle to a point in phase space indicated by the arrow. The dotted blue circle represents the set of points to which light would send the system at all possible phases of the cycle. In this diagram, vectors for only two examples are shown. The new phase of the system can be determined by the isochrons. The perturbed system would relax back to the limit cycle as it reaches steady state. In A, the strength of the light pulse is weak, and pulses cannot push the system across the singularity to the opposite phases of the cycle. Thus, new phase is similar to old phase and the resetting is Type 1. (B) The limit cycle is the same as that shown in A; however, the strength of the light input is strong and, therefore, the light can push the system across the singularity to the opposite side of the limit cycle, which results in very large phase shifts or Type 0 resetting. The stronger effect of light is represented by a larger (longer) vector. (C) In this limit cycle, the amplitude has been reduced by 30% and is represented by a limit cycle with a smaller diameter. Here the effect of light is the same as in wild type (the vector is the same size), but light now is strong enough to carry the system across the singularity to cause large phase shifts and Type 0 resetting.

References

    1. Vitaterna M. H., King D. P., Chang A. M., Kornhauser J. M., Lowrey P. L., McDonald J. D., Dove W. F., Pinto L. H., Turek F. W., Takahashi J. S. Science. 1994;264:719–725. - PMC - PubMed
    1. King D. P., Vitaterna M. H., Chang A. M., Dove W. F., Pinto L. H., Turek F. W., Takahashi J. S. Genetics. 1997;146:1049–1060. - PMC - PubMed
    1. Antoch M. P., Song E. J., Chang A. M., Vitaterna M. H., Zhao Y., Wilsbacher L. D., Sangoram A. M., King D. P., Pinto L. H., Takahashi J. S. Cell. 1997;89:655–667. - PMC - PubMed
    1. King D. P., Zhao Y., Sangoram A. M., Wilsbacher L. D., Tanaka M., Antoch M. P., Steeves T. D., Vitaterna M. H., Kornhauser J. M., Lowrey P. L., et al. Cell. 1997;89:641–653. - PMC - PubMed
    1. Gekakis N., Staknis D., Nguyen H. B., Davis F. C., Wilsbacher L. D., King D. P., Takahashi J. S., Weitz C. J. Science. 1998;280:1564–1569. - PubMed

Publication types

MeSH terms

LinkOut - more resources