. 2006 Jun 13;103(24):9226-31.
doi: 10.1073/pnas.0600635103. Epub 2006 Jun 5.

Stem cell niches in the adult mouse heart

Affiliations

Stem cell niches in the adult mouse heart

Konrad Urbanek et al. Proc Natl Acad Sci U S A. .

Abstract

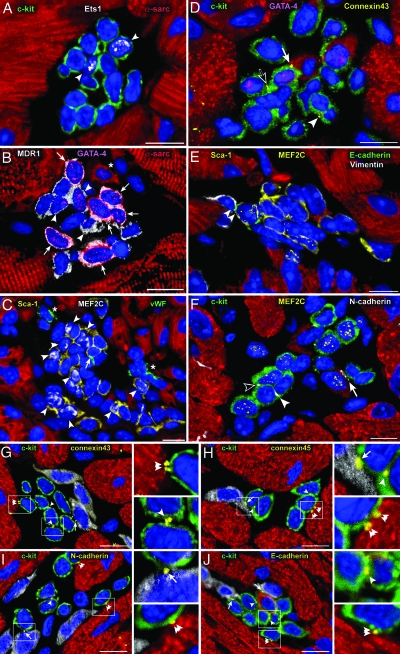
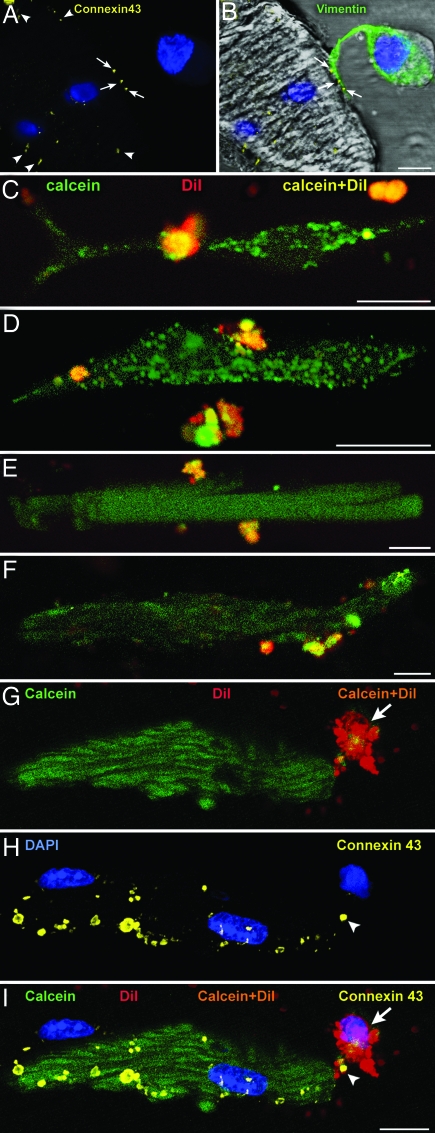
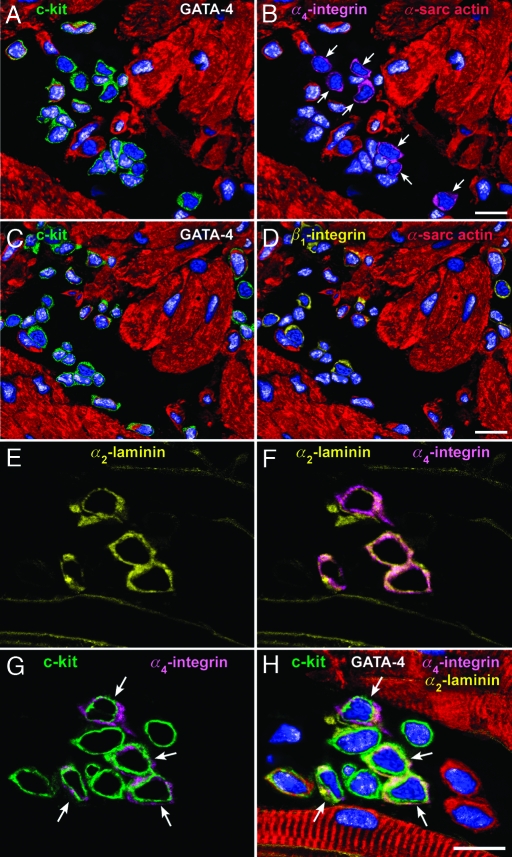
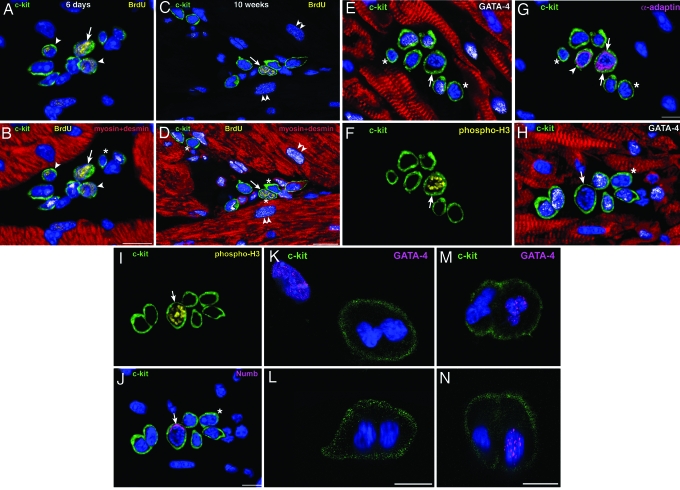
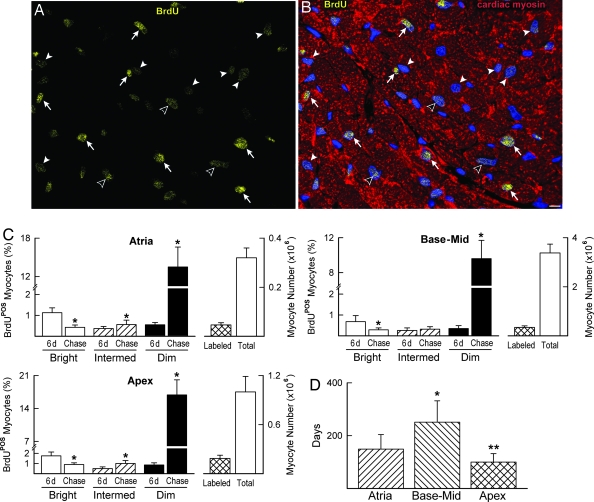
Cardiac stem cells (CSCs) have been identified in the adult heart, but the microenvironment that protects the slow-cycling, undifferentiated, and self-renewing CSCs remains to be determined. We report that the myocardium possesses interstitial structures with the architectural organization of stem cell niches that harbor long-term BrdU-retaining cells. The recognition of long-term label-retaining cells provides functional evidence of resident CSCs in the myocardium, indicating that the heart is an organ regulated by a stem cell compartment. Cardiac niches contain CSCs and lineage-committed cells, which are connected to supporting cells represented by myocytes and fibroblasts. Connexins and cadherins form gap and adherens junctions at the interface of CSCs-lineage-committed cells and supporting cells. The undifferentiated state of CSCs is coupled with the expression of alpha(4)-integrin, which colocalizes with the alpha(2)-chain of laminin and fibronectin. CSCs divide symmetrically and asymmetrically, but asymmetric division predominates, and the replicating CSC gives rise to one daughter CSC and one daughter committed cell. By this mechanism of growth kinetics, the pool of primitive CSCs is preserved, and a myocyte progeny is generated together with endothelial and smooth muscle cells. Thus, CSCs regulate myocyte turnover that is heterogeneous across the heart, faster at the apex and atria, and slower at the base-midregion of the ventricle.


Conflict of interest statement

Conflict of interest statement: No conflicts declared.

Figures

Fig. 1.
Fig. 1.
Cardiac niches and putative supporting cells. Apical (A, B, and F) and atrial (CE) niches contain CSCs and LCCs. (A) Fourteen c-kit+ cells (green) express Ets1 (white dots) in two nuclei (EC progenitors, arrowheads). (B) Fourteen MDR1+ cells (white) express GATA-4 (magenta dots) in nine nuclei; six of the nine GATA-4+ cells express α-sarcomeric-actin in the cytoplasm (red; myocyte precursors, arrows). Three cells positive for GATA-4 only correspond to cardiac progenitors (arrowheads). One small, developing myocyte is visible (asterisk). Five cells express only MDR1 and are lineage-negative (Lin) (CSCs). (C) Twenty-three Sca-1+ cells (yellow) express MEF2C (white dots) in 9 nuclei (myocyte progenitors, arrowheads); one Sca-1+ cell is labeled by von Willebrand factor (green; EC precursor, arrowheads). ECs are also present (asterisks). (D–F) Localization of connexin 43 and E- and N-cadherin in niches containing c-kit+ (D and F, green) and Sca-1+ (E, yellow) CSCs and LCCs. CSCs are Lin; LCCs express GATA-4 (D, magenta-dots) and MEF2C (E and F, yellow dots). Connexin 43 (yellow dots), E-cadherin (green dots), and N-cadherin (white dots) are located between two CSCs (D and F, arrowheads), a CSC and an LCC (F, open arrowhead), an LCC and a fibroblast (E, vimentin, white, double arrowhead), a CSC or an LCC and a myocyte (D and F, arrows), and two LCCs (D, open arrow). (GJ) Connexin 43 and 45 and N- and E-cadherin in atrial niches containing c-kit+ CSCs–LCCs (green) are represented by yellow dots located between two CSCs–LCCs (arrowheads), a CSC–LCC and a fibroblast (arrows), and a CSC–LCC and a myocyte (double arrowheads); see Insets. Nuclei are stained by propidium iodide (blue). (Scale bars, 10 μm.)
Fig. 2.
Fig. 2.
Formation of gap junctions. (A and B) Localization of connexin 43 (A, yellow dots, arrows) between the projection of a c-kit+ CSC–LCC (B, vimentin, green) and an unlabeled myocyte (B, vimentin-negative) in culture. Connexin 43 is present in other areas of the myocyte surface (A, arrowheads). (CF) Two-photon microscopy of c-kit+ CSCs–LCCs loaded with calcein and 1,1'-dioctadecyl-3,3,3',3'-tetramethylindocarbocyanine (yellow fluorescence) and cocultured with unlabeled fibroblasts or unlabeled myocytes. Green fluorescence in fibroblasts (C and D) and myocytes (E and F) demonstrates the translocation of calcein (green) from CSCs–LCCs to fibroblasts and myocytes. (GI) Two-photon microscopy of a myocyte and adjacent CSC–LCC (G). Calcein–1,1'-dioctadecyl-3,3,3',3'-tetramethylindocarbocyanine (orange) is apparent in the CSC–LCC (arrows) but not in the myocyte, which is calcein+ only (green). The same cells are shown after fixation and staining by confocal microscopy (H). Connexin 43 between the cells is depicted by yellow dots (H and I, arrowheads). (I) Merge of G and H. (Scale bars, 10 μm.)
Fig. 3.
Fig. 3.
Cardiac niches, integrin receptors, and extracellular ligands. Apical (A–D) and atrial (E–H) niches contain integrin subunits and laminin. (A–D) The same niche is illustrated at two distinct levels: One (A and B) and two (C and D). c-kit+ cells (A, green), which do not express GATA-4 in their nuclei (A and B, white dots), possess α4-integrin on the cell surface (B, magenta, arrows). However, c-kit+ cells (C, green), which express or do not express GATA-4 (C and D, white dots) possess β1-integrin (D, yellow). (E–H) The α2-chain of laminin (E, F, and H, yellow) is associated with α4-integrin (F–H, magenta) in four of the nine c-kit+ cells (G and H, green, arrows). The four α2-laminin α4-integrin c-kit+ cells are negative for GATA-4; GATA-4 is present in the other five c-kit+ cells (H, white dots). (Scale bars, 10 μm.)
Fig. 4.
Fig. 4.
CSC growth in cardiac niches. (A–D) Atrial niches with bright (arrows) and dim (arrowheads) BrdU+ (yellow) c-kit+ cells (green) after 6 days of labeling (A and B illustrate the same field) and 10 weeks of chasing period (C and D illustrate the same field). Niches contain c-kit+ LCCs (transcription factors, white dots; cardiac myosin and desmin, red) and c-kit+Lin CSCs (B and D, asterisks). (D) Three Lin CSCs, one of which is BrdU-bright (arrow). Two dim BrdU-labeled myocytes are present (C and D, double arrowheads). (E–G) Atrial niche with seven c-kit+ cells (green), three of which express GATA-4 (E, white dots). One GATA-4c-kit+ cell (E, arrow) expresses phospho-H3 (F, yellow, arrow) and shows α-adaptin at both poles of the cell (G, magenta, arrows). The nonmitotic α-adaptin+GATA-4 cell may represent a recently formed daughter CSC (G, arrowhead). The two remaining c-kit+GATA-4 cells may correspond to quiescent CSCs (E and G, asterisks). (H–J) Atrial niche with seven c-kit+ cells (green), five of which express GATA-4 (H, white dots). One GATA-4c-kit+ cell (H, arrow) expresses phospho-H3 (I, yellow) and shows Numb at one pole of the cell (J, magenta, arrow). The remaining c-kit+GATA-4 cell may correspond to a quiescent CSC (H and J, asterisks). (K–N) Two c-kit+ cells (green) in culture at the end of mitosis are illustrated in the xy (K and M) and the xz (L and N) plane. The absence (K and L) and presence (M and N) of GATA-4 (magenta dots) suggest symmetric and asymmetric division, respectively. (Scale bars, 10 μm.)
Fig. 5.
Fig. 5.
Myocyte turnover and life span. (A and B) Apical section illustrating bright (arrows), intermediate (open arrowheads), and dim (arrowheads) BrdU+ myocyte nuclei (yellow) after 10 weeks of chasing. Myocytes are stained by cardiac myosin (B, red). (Scale bar, 10 μm.) (C) Bars show the percentage of BrdU-bright, -intermediate, and -dim myocyte nuclei after 6-day labeling and after 10-week chasing. (Right) Bars document the total number of BrdU+ myocytes (labeled) and the total number of myocytes in the atria, base–midregion, and apex. ∗, P < 0.05 vs. 6 days. (D) Myocyte half-life. ∗ and ∗∗, P < 0.05 vs. atria and base–midregion, respectively.

References

    1. Chien K. R. Nature. 2004;428:607–608. - PubMed
    1. Leri A., Kajstura J., Anversa P. Physiol. Rev. 2005;85:1373–1416. - PubMed
    1. Urbanek K., Torella D., Sheikh F., De Angelis A., Nurzynska D., Silvestri F., Beltrami C. A., Bussani R., Beltrami A. P., Quaini F., et al. Proc. Natl. Acad. Sci. USA. 2005;102:8692–8971. - PMC - PubMed
    1. Hierlihy A. M., Seale P., Lobe C. G., Rudnicki M. A., Megeney L. A. FEBS Lett. 2002;530:239–243. - PubMed
    1. Beltrami A. P., Barlucchi L., Torella D., Baker M., Limana F., Chimenti S., Kasahara H., Rota M., Musso E., Urbanek K., et al. Cell. 2003;114:763–776. - PubMed

Publication types