. 2006 Jun 5;173(5):755-65.
doi: 10.1083/jcb.200512141.

Cytosolic inositol 1,4,5-trisphosphate dynamics during intracellular calcium oscillations in living cells

Affiliations

Cytosolic inositol 1,4,5-trisphosphate dynamics during intracellular calcium oscillations in living cells

Toru Matsu-ura et al. J Cell Biol. .

Abstract

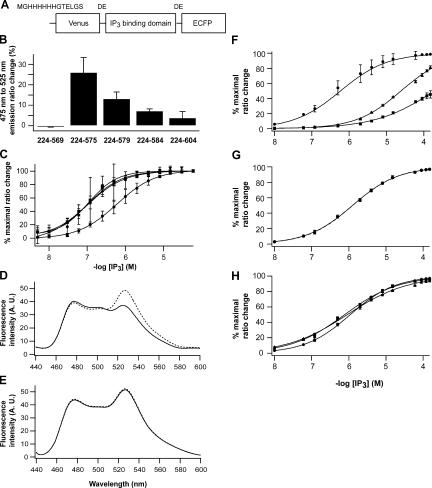
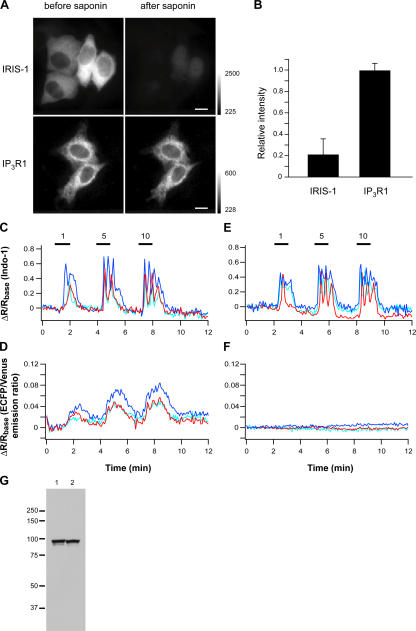
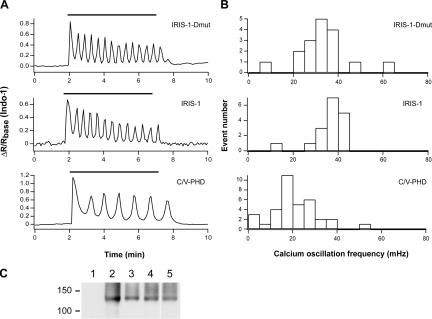
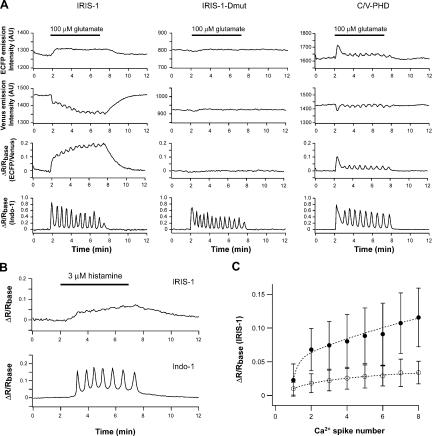
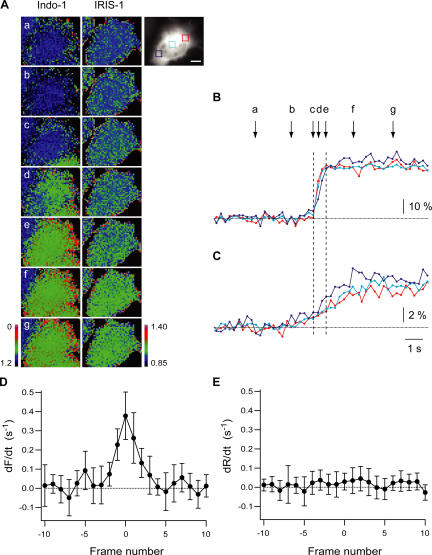
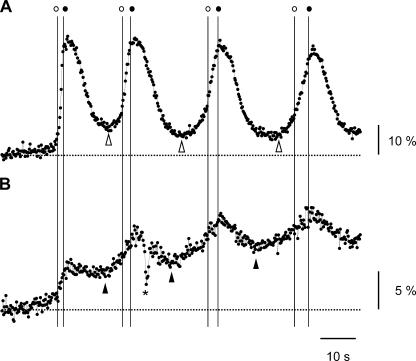
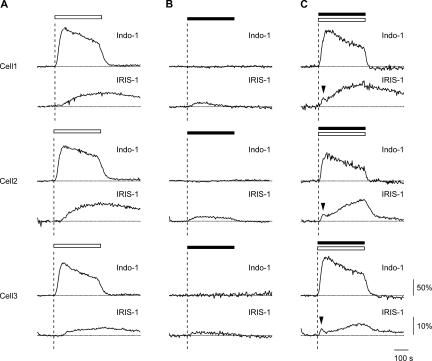
We developed genetically encoded fluorescent inositol 1,4,5-trisphosphate (IP3) sensors that do not severely interfere with intracellular Ca2+ dynamics and used them to monitor the spatiotemporal dynamics of both cytosolic IP3 and Ca2+ in single HeLa cells after stimulation of exogenously expressed metabotropic glutamate receptor 5a or endogenous histamine receptors. IP3 started to increase at a relatively constant rate before the pacemaker Ca2+ rise, and the subsequent abrupt Ca2+ rise was not accompanied by any acceleration in the rate of increase in IP3. Cytosolic [IP3] did not return to its basal level during the intervals between Ca2+ spikes, and IP3 gradually accumulated in the cytosol with a little or no fluctuations during cytosolic Ca2+ oscillations. These results indicate that the Ca2+ -induced regenerative IP3 production is not a driving force of the upstroke of Ca2+ spikes and that the apparent IP3 sensitivity for Ca2+ spike generation progressively decreases during Ca2+ oscillations.


Figures

Figure 1.
Figure 1.
IP3 sensor proteins based on the IP3 binding domain of mouse IP3R1. (A) A basic design for IP3 sensors. (B) ECFP/Venus emission ratio changes of IP3 sensors in COS7 lysates after the addition of 60 μM of IP3. (C) Apparent IP3 affinity of IP3 sensors composed with amino acid residues 224–575 (circle), 224–579 (triangle), 224–584 (square), and 224–604 (inverse triangle) in COS7 lysates. Data were obtained from three independent measurements. Emission spectra of purified IRIS-1 (D) and IRIS-1–Dmut (E) excited at 420 nm with 0 μM (broken line) and 100 μM (solid line) of IP3. Measurements were performed at 20°C in buffer A (10 mM Hepes, pH 7.2, 100 mM NaCl, 1 mM 2-mercaptoethanol, and 0.5% NP-40) containing 1 mM EDTA. (F) Specificity of IRIS-1 against IP3 (circle) and its natural metabolites, 1,3,4,5 IP4 (triangle) and 1,4 IP2 (square). Measurements were performed at 20°C in buffer A containing 1 mM EDTA. (G) Ca2+ sensitivity of IRIS-1. Emission of IRIS-1 was measured in buffer A containing 1 mM HEDTA (circle) or 1 μM free Ca2+ (square). The free Ca2+ concentration was adjusted as described elsewhere (Michikawa et al., 1999). (H) pH sensitivity of IRIS-1. Three buffers with different pH (circle, pH 7.0; square, pH 7.4; triangle, pH 7.8) were prepared based on buffer A containing 1 mM EDTA. Error bars correspond to the SD (n = 3).
Figure 2.
Figure 2.
Characterization of IRIS-1 expressed in HeLa cells. (A) Intracellular localization of IRIS-1 and ECFP-tagged mouse IP3R1 shown by the ECFP fluorescence excited at 425–445 nm. Cells were treated with a solution containing 0.1% saponin, 80 mM Pipes, pH 7.2, 1 mM MgCl2, 1 mM EGTA, and 4% polyethylen glycol for 5 min at room temperature and were washed with balanced salt solution for 10 min. Bars, 10 μm. (B) Relative fluorescence intensity of IRIS-1 (n = 20) and ECFP-tagged IP3R1 (n = 6) after the saponin treatment. Error bars indicate SD. (C–F) Time courses of emission changes of Indo-1 (C) and IRIS-1 (D) in a single HeLa cell sequentially stimulated with 1, 5, and 10 μM of histamine (horizontal bars). The same experiments were performed in IRIS-1–Dmut–expressing HeLa cells (E and F). Three different color plots represent data from three cells in the same viewing field (C–F). ECFP/Venus emission ratio (IRISs and C/V-PHD) and 420–440/460–510-nm emission ratio (Indo-1) were defined as R, and ΔR was defined as R − Rbase, where Rbase is the basal level of R, in this and the following figures. (G) Expression levels of IRIS-1 (lane 1) and IRIS-1–Dmut (lane 2) in HeLa cells assessed by Western blot analysis using an anti-GFP antibody. Similar results were observed in three independent experiments. Molecular mass markers are shown on the left (×10−3).
Figure 3.
Figure 3.
Effects of exogenously expressed proteins on Ca2+ oscillation frequency in mGluR5a-expressing HeLa cells. (A) Emission ratio change of Indo-1 signals in cells stimulated with 100 μM of glutamate (horizontal bars). (B) Histograms of Ca2+ oscillation frequency in mGluR5a-expressing cells stimulated with 100 μM of glutamate. (C) Western blot analysis of cell lysates prepared from HeLa cells transfected with mGluR5a alone (lane 2), mGluR5a plus C/V-PHD (lane 3), mGluR5a plus IRIS-1 (lane 4), or mGluR5a plus IRIS-1–Dmut (lane 5). Nontransfected cells were used as a control (lane 1). An anti-mGluR5 antibody was used. Molecular mass markers are shown on the left (×10−3).
Figure 4.
Figure 4.
IP3 dynamics during Ca2+ oscillations. (A) HeLa cells expressing mGluR5a were stimulated with 100 μM of glutamate (horizontal bars). Similar results were observed in 28 out of 29 cells (IRIS-1), 15 out of 17 cells (IRIS-1–Dmut), and 3 out of 12 cells (C/V-PHD). (B) IRIS-1–expressing HeLa cells were stimulated with 3 μM of histamine (horizontal bar). Similar results were observed in 15 cells. (C) The IP3 concentrations at the time of the onset of each Ca2+ spike are shown over the Ca2+ spike number. Results from mGluR5a-expressing HeLa cells stimulated with 100 μM of glutamate (closed circle) and HeLa cells stimulated with 3 μM of histamine (open circle) are shown. Values are averaged for 14–24 measurements (closed circle) and 6–15 measurements (open circle). Error bars correspond to the SD.
Figure 5.
Figure 5.
IP3 dynamics during the first Ca2+ spikes evoked in mGluR5a-expressing HeLa cells. (A) Pseudocolor images of Indo-1 and IRIS-1 signals in mGluR5a-expressing HeLa cells treated with 100 μM glutamate. The fluorescent signal of Venus of IRIS-1 before the glutamate stimulation is shown as a gray-scale image. Emission at 460–490 nm (F) divided by its basal level (Fbase) and ECFP/Venus emission ratio (R) divided by its basal level (Rbase) are shown for Indo-1 (F/Fbase) and IRIS-1 (R/Rbase), respectively. Images at times a–g, which are indicated in B, are shown. Bar, 20 μm. (B and C) Time courses of emission changes of Indo-1 (−F/Fbase; B) and IRIS-1 (R/Rbase; C) during the first Ca2+ spike evoked by 100 μM glutamate. Signals in the area shown in the gray-scale image (A) have been plotted. Broken horizontal lines indicate baseline levels. Broken vertical lines (c and e) indicate the onset and the end of the abrupt [Ca2+]c rise. (D and E) Differentiated signals of Indo-1 (D) and IRIS-1 (E) aligned by the time when the differentiated Indo-1 signal was at its maximum (frame 0). All data were collected from relatively small regions (40 × 40 pixels; 12.8 × 12.8 μm) located in the cytosol. Error bars correspond to the SD (n = 13).
Figure 6.
Figure 6.
IP3 dynamics during the first and the subsequent Ca2+ spikes in mGluR5a-expressing HeLa cells. Time courses of emission changes of Indo-1 (−F/Fbase; A) and IRIS-1 (R/Rbase; B) during the first four Ca2+ spikes evoked by 100 μM glutamate. Broken horizontal lines indicate baseline levels. Vertical lines indicate the time of the onset (open circle) and the end (closed circle) of the abrupt [Ca2+]c rises. Open and closed arrowheads indicate the time of onset of the increase in the Indo-1 and IRIS-1 signals, respectively. The asterisk represents an artifact.
Figure 7.
Figure 7.
Ca2+-dependent component of IP3 production in HeLa cells. Cells were treated with 1 μM thapsigargin in the absence of extracellular Ca2+ for 5 min and then exposed to 2 mM extracellular Ca2+ (A, open horizontal bar), 3 μM histamine (B, closed horizontal bar), or 3 μM histamine plus 2 mM extracellular Ca2+ (C, open and closed horizontal bars). Indo-1 signals (ΔR/Rbase; top) and IRIS-1 signals (ΔR/Rbase; bottom) of three cells are shown. Arrowheads point to transient [IP3]c increases. Broken horizontal lines indicate the baseline level of Indo-1 and IRIS-1 signals. Broken vertical lines indicate the time of the onset of stimulation. Images were acquired every 4 s.

References

    1. Allbritton, N.L., T. Meyer, and L. Stryer. 1992. Range of messenger action of calcium ion and inositol 1,4,5-trisphosphate. Science. 258:1812–1815. - PubMed
    1. Berridge, M.J. 1988. Inositol trisphosphate-induced membrane potential oscillations in Xenopus oocytes. J. Physiol. 403:589–599. - PMC - PubMed
    1. Berridge, M.J., and G. Dupont. 1994. Spatial and temporal signalling by calcium. Curr. Opin. Cell Biol. 6:267–274. - PubMed
    1. Berridge, M.J., P. Lipp, and M.D. Bootman. 2000. The versatility and universality of calcium signalling. Nat. Rev. Mol. Cell Biol. 1:11–21. - PubMed
    1. Bootman, M.D., and M.J. Berridge. 1996. Subcellular Ca2+ signals underlying waves and graded responses in HeLa cells. Curr. Biol. 6:855–865. - PubMed

Publication types

MeSH terms

Substances