. 2001 Feb 15;105(6):1240-9.
doi: 10.1021/jp001236s.

Resonance Raman Structural Evidence that the Cis-to-Trans Isomerization in Rhodopsin Occurs in Femtoseconds

Affiliations

Resonance Raman Structural Evidence that the Cis-to-Trans Isomerization in Rhodopsin Occurs in Femtoseconds

J E Kim et al. J Phys Chem B. .

Abstract

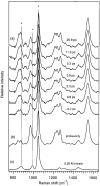
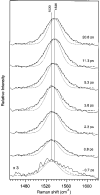
Picosecond time-resolved resonance Raman spectroscopy is used to probe the structural changes of rhodopsin's retinal chromophore as the cis-to-trans isomerization reaction occurs that initiates vision. Room-temperature resonance Raman spectra of rhodopsin's photoproduct with time delays from -0.7 to 20.8 ps are measured using 2.2 ps, 480 nm pump and 1.5 ps, 600 nm probe pulses. Hydrogen-out-of-plane (HOOP) modes at 852, 871, and 919 cm(-1), fingerprint peaks at 1272, 1236, 1211, and 1166 cm(-1), and a broad red-shifted ethylenic band at 1530 cm(-1) are present at the earliest positive pump-probe time delay of 0.8 ps, indicating that the chromophore is already in a strained, all-trans configuration. Kinetic analyses of both the HOOP and ethylenic regions of the photoproduct spectra reveal that these features grow in with fast ( approximately 200 fs) and slow ( approximately 2-3 ps) components. These data provide the first structural evidence that photorhodopsin has a thermally unrelaxed, torsionally strained all-trans chromophore within approximately 1 ps, and possibly within 200 fs, of photon absorption. Following this ultrafast product formation, the all-trans chromophore cools and conformationally relaxes within a few picoseconds to form bathorhodopsin. This cooling process is revealed as an ethylenic frequency blue-shift of 6 cm(-1) (tau approximately 3.5 ps) as well as an ethylenic width narrowing (tau approximately 2 ps). The ultrafast production of photorhodopsin is likely accompanied by an impulsively driven, localized protein response. More delocalized protein modes are unable to relax on this ultrafast time scale enabling the chromophore-protein complex to store the large amounts of photon energy (30-35 kcal/mol) that are subsequently used to drive activating protein conformational changes.


Figures

Figure 1
Figure 1
Schematic of laser apparatus for two-color pump/probe Raman experiments. AC, autocorrelator; BBO, β-barium borate crystal; DM1 and DM2, dichroic mirrors; λ/2, half-wave plate; SHG, second-harmonic light; LPF, long-pass filter; CCD, charge-coupled device detector.
Figure 2
Figure 2
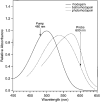
Relative absorbances of rhodopsin (solid line), bathorhodopsin (dashed line), and photorhodopsin (dotted line) at room temperature. Bathorhodopsin and photorhodopsin spectra are adapted from Kandori et al. Laser wavelengths used in the two-beam, pump−probe experiments are indicated.
Figure 3
Figure 3
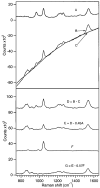
Two-color data reduction procedure using 20.8 ps delay spectra as an example. Top part. Spectrum (A) is the probe-only minus bleach, spectrum (B) is pump + probe minus bleach, (C) is pump-only minus bleach. Negative counts are a consequence of the bleach spectra having higher background levels than corresponding unbleached spectra. Bottom part. Spectrum (D), the photolysis spectrum, is pump + probe (B) minus pump-only (C). A fraction of the probe-only spectrum (A) is then subtracted from this photolysis spectrum to yield a difference spectrum (E). To remove scattering due to nitrate, a fraction of the 0.25-M nitrate spectrum (F) is subtracted to yield a difference spectrum consisting of just the photoproduct (G). All spectra in the bottom part were background-corrected for broad fluorescent backgrounds using spline fits.
Figure 4
Figure 4
(a) Two-color pump + probe time-resolved resonance Raman photolysis spectra of the rhodopsin to bathorhodopsin transition using 480 nm pump (200 nJ) and 600 nm probe (410 nJ) pulses. Peaks indicated by the asterisk are due to nitrate. The buffered rhodopsin solution had a starting OD of 1.5/cm at 500 nm and consisted of 150 mM PO43− with 1% Ammonyx-LO, < 3 mM NH2OH, and 0.25-M NO3. (b) Probe-only (600 nm) rhodopsin spectrum. (c) Nitrate spectrum (0.25-M NO3, 150 mM PO43−, 1% Ammonyx-LO and < 3 mM NH2OH).
Figure 5
Figure 5
Two-color time-resolved resonance Raman difference spectra of photorhodopsin and bathorhodopsin at room temperature. The pump and probe wavelengths and powers as well as sample conditions are the same as in Figure 4.
Figure 6
Figure 6
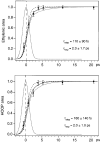
Kinetic appearance of photoproduct lines as a function of time delay. Top () Ethylenic areas are presented along with a least-squares fit for the convolution of the laser cross-correlation with the function in eq 2, yielding parameter values of A = 0.75, B = 0.25, σfwhm = 50 fs, τstep = 110 ± 90 fs, and τexp = 2.3 ± 1.7 ps. The dashed lines indicate the fit at the 95% confidence limit using τstep = 200 fs, τexp = 4.0 ps and τstep = 20 fs, τexp = 0.7 ps with A, B, and σfwhm unchanged. Bottom () HOOP (815–940 cm−1) areas are presented along with a temporal convolution of the laser cross-correlation with the same function as above, yielding best fit parameters of A = 0.58, B = 0.42, fwhm = 50 fs, τstep = 160 ± 140 fs and τexp = 2.0 ± 1.0 ps. Dashed lines indicate the fit at the 95% confidence limit using τstep = 200 fs, τexp = 4.0 ps and τstep = 20 fs, τexp = 0.7 ps with A, B, and σfwhm unchanged. The dotted lines indicate the laser cross correlation.
Figure 7
Figure 7
Deconvolution of the ethylenic regions of the photoproduct spectra from Figure 5. The raw data and a Gaussian fit to the raw data are indicated by the solid and dashed lines, respectively. The dotted line is the deconvolved ethylenic line.
Figure 8
Figure 8
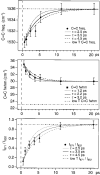
Top. () Plot of photoproduct ethylenic frequency as a function of time delay. Single-exponential functions with τ = 2.5 ps (···), τ = 3.5 ps (—) and τ = 4.5 ps (- - -) are also shown. The 77 K bathorhodopsin C=C frequency is also indicated (dashed–dotted line). Middle. (■) Plot of photoproduct ethylenic width as a function of delay time. Single-exponential functions with τ = 1.2 ps (···), τ = 2.2 ps (—) and τ = 3.2 ps (- - -) are also shown. The 77 K bathorhodopsin C=C width is also indicated (dashed–dotted line). Bottom. () Plot of the ratio I871/I852 of photoproduct HOOP lines as a function of average positive time delay. Single-exponential functions with τ = 2.5 ps (···), τ = 3.5 ps (—) and τ = 4.5 ps (- - -) are shown. The 77 K bathorhodopsin I871/I852 ratio is also indicated (dashed–dotted line).
Figure 9
Figure 9
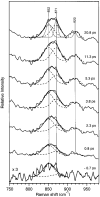
Deconvolution and decomposition of the photoproduct HOOP intensities. The best fit to the experimental data is indicated by the solid line and the individual convolved HOOP components that were summed to achieve the best fit are indicated by the dashed lines. The low-temperature photoproduct peaks at 852, 871, and 920 cm−1 used as basis spectra are indicated by the dotted lines in the 20.8 ps spectrum.
Figure 10
Figure 10
Two-color, time-resolved resonance Raman spectra of photorhodopsin (2.3 ps spectrum) and bathorhodopsin (20.8 ps spectrum) at room-temperature. For comparison the RR spectra of room-temperature rhodopsin and of the photoproduct trapped at 77 K are also presented. Normal mode assignments are taken from Palings et al.,
Figure 11
Figure 11
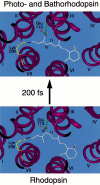
Model of the retinal binding site in rhodopsin illustrating the structural changes in the primary event. The 11-cis to all-trans photoisomerization reaction in rhodopsin is complete in 200 fs and is accompanied by impulsively driven, localized protein motion. The lack of any global motion may be important for the energy storage mechanism. The chromophore in photorhodopsin is twisted 20° in the same direction about the C8–C9,C10–C11,C12–C13, and C14–C15 bonds in order to explain the resonance enhancement of the bathorhodopsin HOOP modes. The C12–Glu113 distance is ∼3 Å in both rhodopsin and its photoproduct. The absolute twists around the C12–C13 bond of the chromophore in rhodopsin and photorhodopsin are consistent with an enantioselective binding study. (Adapted from ref 63.)

References

    1. Fleming GR, van Grondelle R. Curr. Opin. Struct. Biol. 1997;7:738–748. - PubMed
    1. Genick U, Borgstahl G, Kingman N, Zhong R, Pradervand C, Burke P, Srajer V, Teng T-Y, Schildkamp W, Mcree D, Moffat K, Getzoff E. Science. 1997;275:1471–1475. - PubMed
    1. Hoff WD, Xie A, van Stokkum IHM, Tang X-J, Gural J, Kroon AR, Hellingwerf KJ. Biochemistry. 1999;38:1009–1017. - PubMed
    1. Haupts U, Tittor J, Oesterhelt D. Annu. Rev. Biophys. Biomol. Struct. 1999;28:367–399. - PubMed
    1. Kochendoerfer GG, Mathies RA. Isr. J. Chem. 1995;35:211–226.

LinkOut - more resources