Review
. 2006 Jun 6:5:36.
doi: 10.1186/1475-925X-5-36.

Multi-photon excitation microscopy

Affiliations
Review

Multi-photon excitation microscopy

Alberto Diaspro et al. Biomed Eng Online. .

Abstract

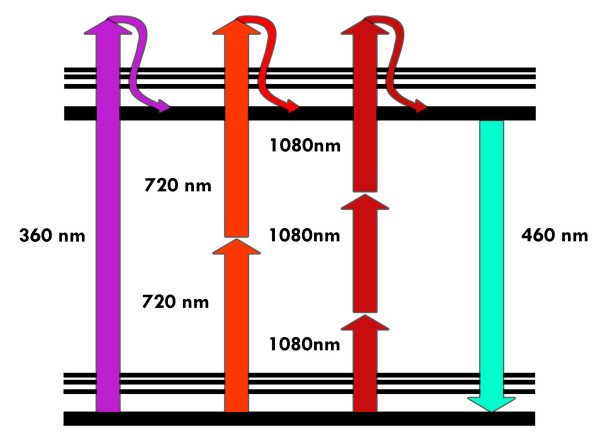
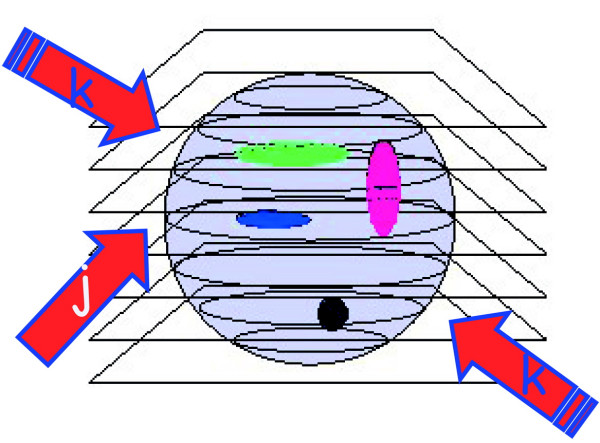
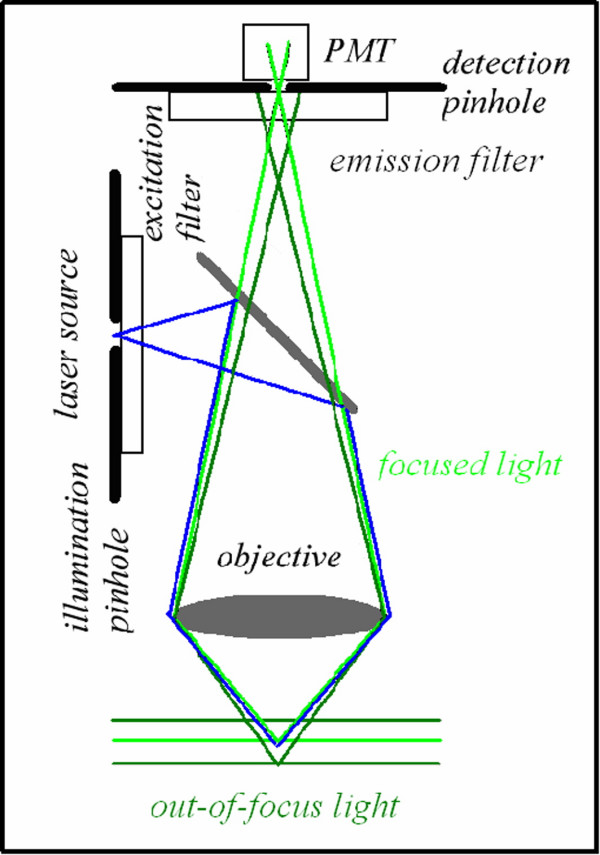
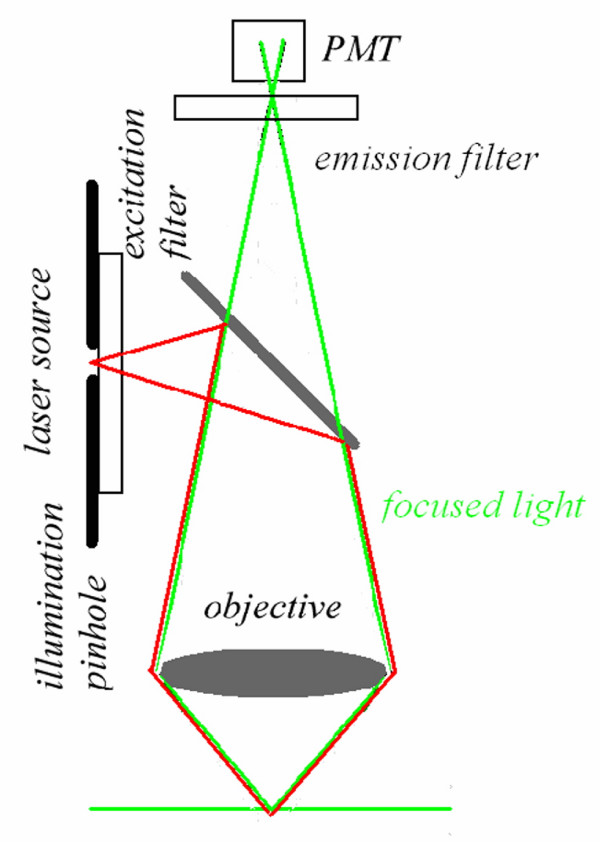
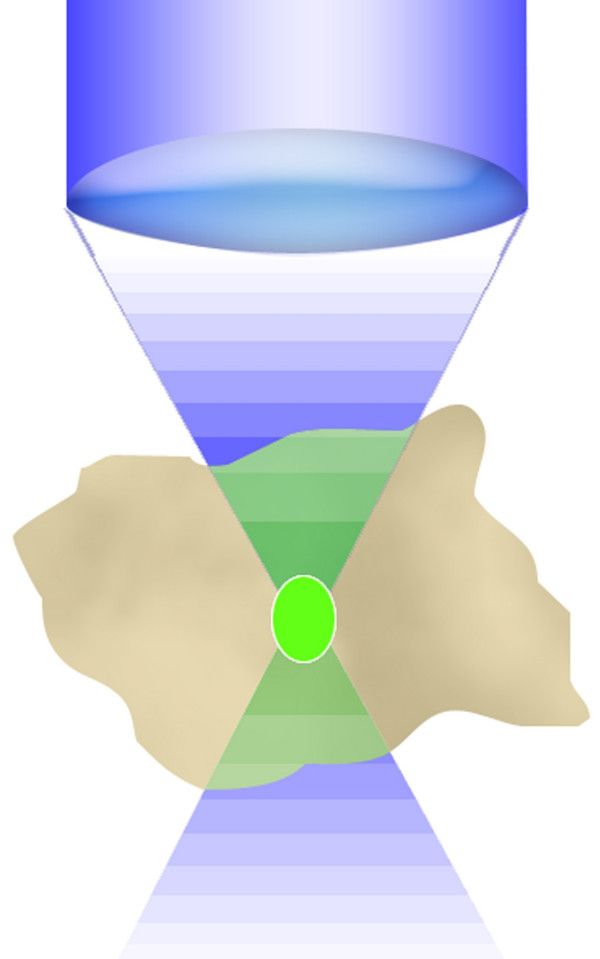
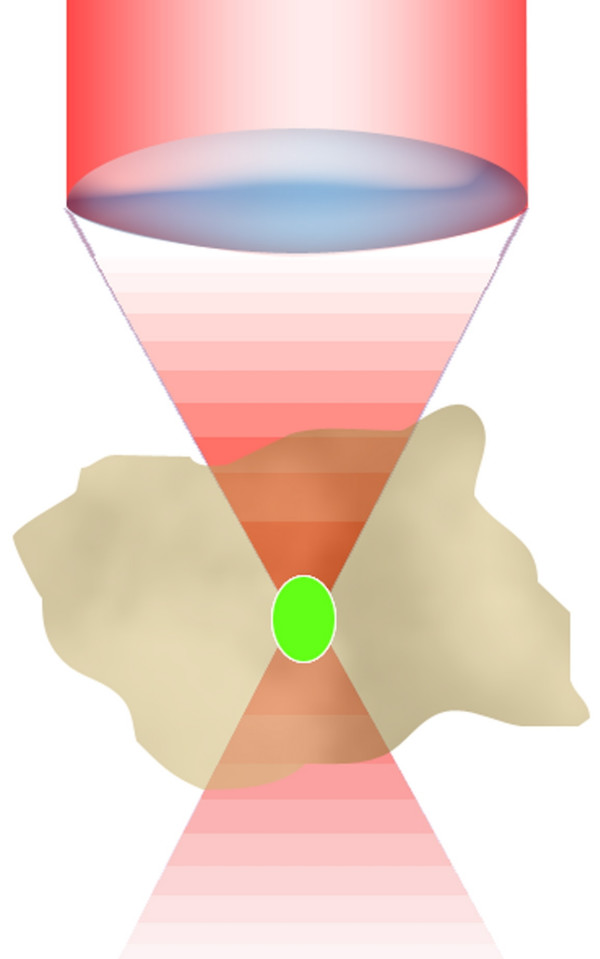
Multi-photon excitation (MPE) microscopy plays a growing role among microscopical techniques utilized for studying biological matter. In conjunction with confocal microscopy it can be considered the imaging workhorse of life science laboratories. Its roots can be found in a fundamental work written by Maria Goeppert Mayer more than 70 years ago. Nowadays, 2PE and MPE microscopes are expected to increase their impact in areas such biotechnology, neurobiology, embryology, tissue engineering, materials science where imaging can be coupled to the possibility of using the microscopes in an active way, too. As well, 2PE implementations in noninvasive optical bioscopy or laser-based treatments point out to the relevance in clinical applications. Here we report about some basic aspects related to the phenomenon, implications in three-dimensional imaging microscopy, practical aspects related to design and realization of MPE microscopes, and we only give a list of potential applications and variations on the theme in order to offer a starting point for advancing new applications and developments.


Figures

Figure 1
Figure 1
Perrin-Jablonski fluorescence diagram. Simplified Perrin-Jablonski scheme for 1PE, 2PE and 3PE. Once the excited state has been reached the subsequent fluorescent emission is the very same for the three different modalities of excitation.
Figure 2
Figure 2
Optical sectioning scheme. A three-dimensional sample can be sketched as a series of optical slices. Let's call slice j the one containing the geometrical focus of the objective and refer to the adjacent planes as k slices. The sample contains a three-dimensional distribution of fluorescently labelled molecules whose intensity distribution is I, slice by slice. The thickness of each optical slice is approximately one half of the axial resolution, say ≈λ/2.
Figure 3
Figure 3
Confocal optical pathways. An illumination and a detection pinhole are placed in the optical pathway. The detection pinhole – the mask – is placed in front of the detector at a plane that is conjugate to the in-focus or "j" plane, such that the illumination spot and the pinhole aperture are simultaneously focused at the same specimen volume. This coincidence of the illumination and detected volume is responsible for confocality. The illumination pinhole allows to perform pointlike scanning.
Figure 4
Figure 4
MPE simplified optical pathways. In the MPE optical pathways the emission pinhole is removed since the only emitted light reaching the sensor is coming from the currently point scanned volume in the sample. No other fluorescence signal is produced elsewhere.
Figure 5
Figure 5
Confocal fluorescence emission distribution. The emission process, in green, under blue 1PE excitation is broadened in the whole double cone excitation shape within the analyzed cell.
Figure 6
Figure 6
MPE fluorescence emission distribution. Confinement of the emission process, in green, under red 2PE. Under 2PE the only molecules excited are those confined in a small subfemtoliter volume at the illumination beam focus position. This is particularly relevant for the photobleaching process that is globally reduced with respect to the 1PE case. The capacity of the volume can be approximatively calculated by using the resolution parameters of the optical system, since they are indicators of the volume containing the maximum photon density. This is valid only for non saturated processes. Under saturation of fluorescence beam intensity plays an important role in the emission shape and optical resolution.
Figure 7
Figure 7
Pointlike emitter optical response. From left to right: calculated x-y (above) and r-z (below) intensity distributions, in logarithmic scale, for a point like source imaged by means of wide-field, 2PE and confocal microscopy. Both 2PE and confocal shapes exhibit a better signal to noise ratio than widefield case. 2PE distribution is larger due the fact that a wavelength twice than in the wide-field and confocal case is responsible for the intensity distribution. Such intensity distributions are also known as point spread functions of the related microscopes. Optical conditions: excitation wavelengths are 488 nm and 900 nm for 1PE and 2PE, respectively; emission wavelength is 520 nm; numerical aperture is 1.3 for an oil immersion objective with oil refractive index value set at 1.515.
Figure 8
Figure 8
MPE simplified optical schemes. Descanned (red dot) and non-descanned (blue dot) schemes for 2PE microscopy. Due to the confinement of the excitation process when operating in non-descanned mode the collection efficiency in depth is increased as shown by the two side views from the very same thick scattering sample (Courtesy of Mark Cannel and Christian Soeller; image inset courtesy of Ammasi Periasamy).
Figure 9
Figure 9
Optical sectioning using 2PE autofluorescence. 2PE optical sectioning of Colpoda maupasi resting cysts, 21–32 μm average dimensions. Encystment is particularly widespread in species living in ephemeral fresh-water puddles and is induced by exhaustion of the food and drying out. The resulting images have been obtained at LAMBS-MicroScoBio exploiting autofluorescence primed using 740 nm excitation. A Chameleon-XR ultrafast Ti-Sapphire laser (Coherent Inc., USA) and a Nikon PCM2000 confocal scanning head have been used [34]. Linear frame dimension is 70 μm, z steps have been performed every 0.5 μm, and not all the optical sections are imaged.
Figure 10
Figure 10
Multiple fluorescence 2PE imaging. 2PE multiple fluorescence image from a 16 μm cryostat section of mouse intestine stained with a combination of fluorescent stains (F-24631, Molecular Probes). Alexa Fluor 350 wheat germ agglutinin, a blue-fluorescent lectin, was used to stain the mucus of goblet cells. The filamentous actin prevalent in the brush border was stained with red-fluorescent Alexa Flu or 568 phalloidin. Finally, the nuclei were stained with SYTOX ® Green nucleic acid stain. Imaging has been performed at 780 nm, 100 x 1.4 NA Leica objective, using a Chameleon XR ultrafast Ti-Sapphire laser (Coherent Inc., USA) coupled at LAMBS-MicroScoBio with a Spectral Confocal Laser Scanning Microscope, Leica SP2-AOBS.
Figure 11
Figure 11
3D and 2D fluorescence projections. Pictorial representation of the 3D and 2D projections of multiple fluorescence from a marine sponge, Chondrilla nucula. The specimen has been loaded with Alexa 488 fluorescent molecules specific aminobutirric acid (GABA) emitting in green, DAPI for nuclear DNA for the blu component. Red signals are due to the autofluorescence from symbiontic bacteria contamination. Imaging has been perfomed using a Chameleon XR ultrafast Ti-Sapphire laser (Coherent Inc., USA) coupled at LAMBS-MicroScoBio with a Spectral Confocal Laser Scanning Microscope, Leica SP2-AOBS. (Sample availability and preparation, courtesy of Renata Manconi, University of Sassari, Roberto Pronzato and Lorenzo Gallus, University of Genoa).

References

    1. Diaspro A. New World Microscopy. IEEE Engineering In Medicine And Biology Magazine. 1996;15:29–100. doi: 10.1109/MEMB.1996.482790. - DOI
    1. Beltrame F, Bianco B, Castellaro G, Diaspro A. Fluorescence, Absorption, Phase-contrast, Holographic and Acoustical Cytometries of Living Cells. In: Chiabrera A, editor. Interactions between Electromagnetic Fields and Cells. Vol. 97. NATO ASI Series, Plenum Press Publishing, New York and London; 1985. pp. 483–498.
    1. Arndt-Jovin DJ, Nicoud RM, Kaufmann J, Jovin TM. Fluorescence digital-imaging microscopy in cell biology. Science. 1985;230:13330–13335. - PubMed
    1. Fay FS, Carrington W, Fogarty KE. Three-dimensional molecular distribution in single cells analyzed using the digital imaging microscope. J Microsc. 1989;153:133–149. - PubMed
    1. Periasamy A. Methods in Cellular Imaging. Oxford University Press, New York; 2000.

Publication types

MeSH terms