. 2006 Apr;8(4):259-67.
doi: 10.1593/neo.05844.

The functional diffusion map: an imaging biomarker for the early prediction of cancer treatment outcome

Affiliations

The functional diffusion map: an imaging biomarker for the early prediction of cancer treatment outcome

Bradford A Moffat et al. Neoplasia. 2006 Apr.

Abstract

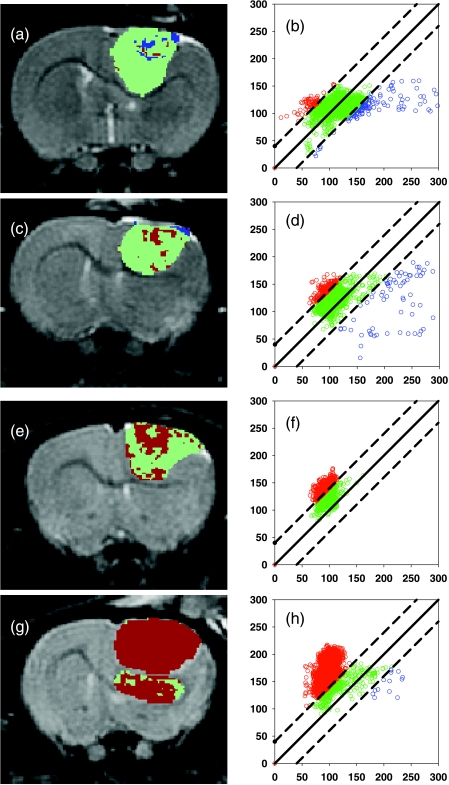
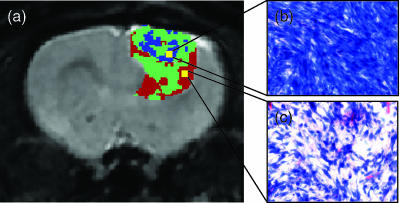
Functional diffusion map (fDM) has been recently reported as an early and quantitative biomarker of clinical brain tumor treatment outcome. This approach spatially maps and quantifies treatment-induced changes in tumor water diffusion values resulting from alterations in cell density/cell membrane function and microenvironment. This current study was designed to evaluate the capability of fDM for preclinical evaluation of dose escalation studies and to determine if these changes were correlated with outcome measures (cell kill and overall survival). Serial T2-weighted were carried out on rodents with orthotopically implanted 9L brain tumors receiving three doses of 1,3-bis(2-chloroethyl)-1-nitrosourea (6.65, 13.3, and 26.6 mg/kg, i.p.). All images were coregistered to baseline T2-weighted images for fDM analysis. Analysis of tumor fDM data on day 4 posttreatment detected dose-dependent changes in tumor diffusion values, which were also found to be spatially dependent. Histologic analysis of treated tumors confirmed spatial changes in cellularity as observed by fDM. Early changes in tumor diffusion values were found to be highly correlative with drug dose and independent biologic outcome measures (cell kill and survival). Therefore, The fDM imaging biomarker for early prediction of treatment efficacy can be used in the drug development process.


Figures

Figure 1
Figure 1
fDM region volumes as a function of fDM threshold for the different treatment groups. (a) The change in VR as a function of the upper threshold of ADC change (m2/sec). (b) The change in VB as a function of the lower threshold of ADC change (m2/sec). The bars represent the mean VR and VB for each group at a given threshold, and the error bars represent the standard error of the mean.
Figure 2
Figure 2
Representative fDM maps and fDM scatter plots for each treatment group. The animals were treated with: (a and b) 0 mg/kg (control); (c and d) 6.65 mg/kg BCNU; (e and f) 13.3 mg/kg BCNU; (g and h) 26.6 mg/kg BCNU. Images of fDMs (a, c, e, and g) reveal red voxels, which are regions with significant increases in ADC, and blue voxels, which are regions within the tumor with significantly decreased ADC values. The green voxels are tumor regions wherein the ADC values did not change (over the defined threshold level of ±0.4 x 10⁻⁹ m2/sec) over 4 days following treatment. Scatter plots corresponding to the fDM are voxel ADC values posttreatment (y-axis) as a function of the baseline (time 0) ADC value (x-axis).
Figure 3
Figure 3
Dose dependence of traditional therapeutic efficacy measures. (a) Kaplan-Meier animal survival plots of animals treated with: (1) 0 mg/kg, (2) 6.65 mg/kg, (3) 13.3 mg/kg, and (4) 26.6 mg/kg BCNU. The median survival for these groups was 7, 13, 23.5, and 35.5 days posttherapy, respectively. All groups were significantly different, as determined by log rank test (P < .05). (b) Normalized tumor volume at the time fDM analysis was performed (4 days) posttreatment with BCNU as a function of dose. The gradient of the least squares fit was -4.0 ± 1.3 (P = .004), and the intercept was 290 ± 20 (P = 1.4 x 10⁻¹⁴). (c) Log cell kill of the 9L tumor cells as a function of BCNU dose. The gradient of the least squares fit was 0.013 ± 0.02 (P = 3.7 x 10⁻⁹), and the intercept was -0.53 ± 0.21 (P = .02). The error bars represent the standard error of the mean for each group.
Figure 4
Figure 4
Dose dependence of detectable changes in fDM parameters VR and VB. (a) Mean normalized volume VR (%) as a function of BCNU dose. The gradient of the least squares fit was 2.30 ± 0.40 (P = 5.8 x 10⁻⁶), and the intercept was -1.1 ± 6.2 (P = .87). (b) Mean normalized volume VB as a function of BCNU dose. The gradient of the least squares fit was -0.10 ± 0.07 (P = .17), and the intercept was 4.5 ± 1.1 (P = .005). The error bars represent the standard error of the mean for each group.
Figure 5
Figure 5
Correlation of fDM VR changes with animal survival and cell kill. (a) VR volumes calculated 4 days post-BCNU therapy are plotted as a function of the median survival for each of the treatment groups. The error bars represent the standard error of the mean for each group. The gradient of the least squares fit was 1.55 ± 0.44 (P = .002), and the intercept was -6.2 ± 9.8 (P = .53). (b) Change in percent fDM versus log cell kill measured using MRI tumor volume measurements over time.
Figure 6
Figure 6
Histologic evaluation of fDM VR and VB regions. (a) A representative fDM image of a 9L tumor showing a heterogeneous response to BCNU (6.65 mg/kg) treatment. The fDM image revealed regions of high (blue) and low (red) restriction of diffusion. (b) H&E-stained slice from a region identified as an fDM (VB) region of restricted diffusion. This region of high tumor diffusional restriction contained decreased amounts of extracellular space, as shown in the H&E image. In addition, this region was found to contain 153 mitoses in 10 high-power fields (original magnification, x 40 objective lens), reflecting a high rate of proliferation. (c) A region of low restriction (VR) is shown to have a moderate level of cellular density, as shown in the H&E image. This region contained 96 mitoses in 10 high-power fields, reflecting mitoses that are fewer than those in the previous region (VB).

References

    1. Le Bihan D, Breton E, Lallemand D, Grenier P, Cabanis E, Laval-Jeantet M. MR imaging of intravoxel incoherent motions: application to diffusion and perfusion in neurologic disorders. Radiology. 1986;161:401–407. - PubMed
    1. Ross BD, Chenevert TL, Kim B, Ben-Joseph O. Magnetic resonance imaging and spectroscopy: application to experimental neurooncology. J Magn Reson Biol Med. 1994;1:89–106. - PMC - PubMed
    1. Zhao M, Pipe JG, Bonnett J, Evelhoch JL. Early detection of treatment response by diffusion-weighted 1H-NMR spectroscopy in a murine tumour in vivo. Br J Cancer. 1996;73:61–64. - PMC - PubMed
    1. Chenevert TL, McKeever PE, Ross BD. Monitoring early response of experimental brain tumors to therapy using diffusion magnetic resonance imaging. Clin Cancer Res. 1997;3:1457–1466. - PubMed
    1. Ross BD, Stegman LD, Chenevert TL, Rehemtulla A. The role of magnetic resonance in the evaluation of cancer therapeutics. Clin Cancer Res. 1999;5:3870s–3871s.

Publication types