Following tetraploidy in an Arabidopsis ancestor, genes were removed preferentially from one homeolog leaving clusters enriched in dose-sensitive genes
- PMID: 16760422
- PMCID: PMC1484460
- DOI: 10.1101/gr.4708406
Following tetraploidy in an Arabidopsis ancestor, genes were removed preferentially from one homeolog leaving clusters enriched in dose-sensitive genes
Abstract
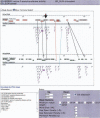
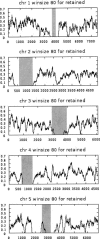
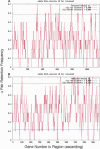
Approximately 90% of Arabidopsis' unique gene content is found in syntenic blocks that were formed during the most recent whole-genome duplication. Within these blocks, 28.6% of the genes have a retained pair; the remaining genes have been lost from one of the homeologs. We create a minimized genome by condensing local duplications to one gene, removing transposons, and including only genes within blocks defined by retained pairs. We use a moving average of retained and non-retained genes to find clusters of retention and then identify the types of genes that appear in clusters at frequencies above expectations. Significant clusters of retention exist for almost all chromosomal segments. Detailed alignments show that, for 85% of the genome, one homeolog was preferentially (1.6x) targeted for fractionation. This homeolog fractionation bias suggests an epigenetic mechanism. We find that islands of retention contain "connected genes," those genes predicted-by the gene balance hypothesis-to be resistant to removal because the products they encode interact with other products in a dose-sensitive manner, creating a web of dependency. Gene families that are overrepresented in clusters include those encoding components of the proteasome/protein modification complexes, signal transduction machinery, ribosomes, and transcription factor complexes. Gene pair fractionation following polyploidy or segmental duplication leaves a genome enriched for "connected" genes. These clusters of duplicate genes may help explain the evolutionary origin of coregulated chromosomal regions and new functional modules.
Figures


Similar articles
-
The preferential retention of starch synthesis genes reveals the impact of whole-genome duplication on grass evolution.Mol Biol Evol. 2008 Jun;25(6):1003-6. doi: 10.1093/molbev/msn052. Epub 2008 Feb 23. Mol Biol Evol. 2008. PMID: 18296698
-
Diversification of non-TIR class NB-LRR genes in relation to whole-genome duplication events in Arabidopsis.Mol Plant Microbe Interact. 2005 Feb;18(2):103-9. doi: 10.1094/MPMI-18-0103. Mol Plant Microbe Interact. 2005. PMID: 15720078
-
Unique genes in plants: specificities and conserved features throughout evolution.BMC Evol Biol. 2008 Oct 10;8:280. doi: 10.1186/1471-2148-8-280. BMC Evol Biol. 2008. PMID: 18847470 Free PMC article.
-
Gene-balanced duplications, like tetraploidy, provide predictable drive to increase morphological complexity.Genome Res. 2006 Jul;16(7):805-14. doi: 10.1101/gr.3681406. Genome Res. 2006. PMID: 16818725 Review.
-
Insights into the structural and functional evolution of plant genomes afforded by the nucleotide sequences of chromosomes 2 and 4 of Arabidopsis thaliana.Yeast. 2000 Apr;17(1):1-5. doi: 10.1002/(SICI)1097-0061(200004)17:1<1::AID-YEA3>3.0.CO;2-V. Yeast. 2000. PMID: 10797596 Free PMC article. Review.
Cited by
-
Unleashing the genome of brassica rapa.Front Plant Sci. 2012 Jul 31;3:172. doi: 10.3389/fpls.2012.00172. eCollection 2012. Front Plant Sci. 2012. PMID: 22866056 Free PMC article.
-
Genome-wide classification and expression analysis of MYB transcription factor families in rice and Arabidopsis.BMC Genomics. 2012 Oct 10;13:544. doi: 10.1186/1471-2164-13-544. BMC Genomics. 2012. PMID: 23050870 Free PMC article.
-
Genome-wide identification and characterization of the Hsp70 gene family in allopolyploid rapeseed (Brassica napus L.) compared with its diploid progenitors.PeerJ. 2019 Aug 20;7:e7511. doi: 10.7717/peerj.7511. eCollection 2019. PeerJ. 2019. PMID: 31497395 Free PMC article.
-
Phylogenetic analysis of seven WRKY genes across the palm subtribe Attaleinae (Arecaceae) [corrected] identifies Syagrus as sister group of the coconut.PLoS One. 2009 Oct 6;4(10):e7353. doi: 10.1371/journal.pone.0007353. PLoS One. 2009. PMID: 19806212 Free PMC article.
-
Differentiation of the maize subgenomes by genome dominance and both ancient and ongoing gene loss.Proc Natl Acad Sci U S A. 2011 Mar 8;108(10):4069-74. doi: 10.1073/pnas.1101368108. Epub 2011 Feb 22. Proc Natl Acad Sci U S A. 2011. PMID: 21368132 Free PMC article.
References
-
- The Arabidopsis Genome Initiative. Analysis of the genome sequence of the flowering plant Arabidopsis thaliana. Nature. 2000;408:796–815. - PubMed
-
- Birchler J.A., Riddle N.C., Auger D.L., Veitia R.A., Riddle N.C., Auger D.L., Veitia R.A., Auger D.L., Veitia R.A., Veitia R.A. Dosage balance in gene regulation: Biological implications. Trends Genet. 2005;21:219–226. - PubMed
Publication types
MeSH terms
LinkOut - more resources
Full Text Sources
