. 2006 Aug;17(8):3484-93.
doi: 10.1091/mbc.e06-03-0190. Epub 2006 Jun 7.

Endocytosis of cadherin from intracellular junctions is the driving force for cadherin adhesive dimer disassembly

Affiliations

Endocytosis of cadherin from intracellular junctions is the driving force for cadherin adhesive dimer disassembly

Regina B Troyanovsky et al. Mol Biol Cell. 2006 Aug.

Abstract

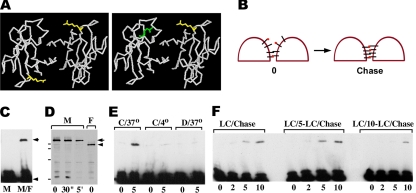
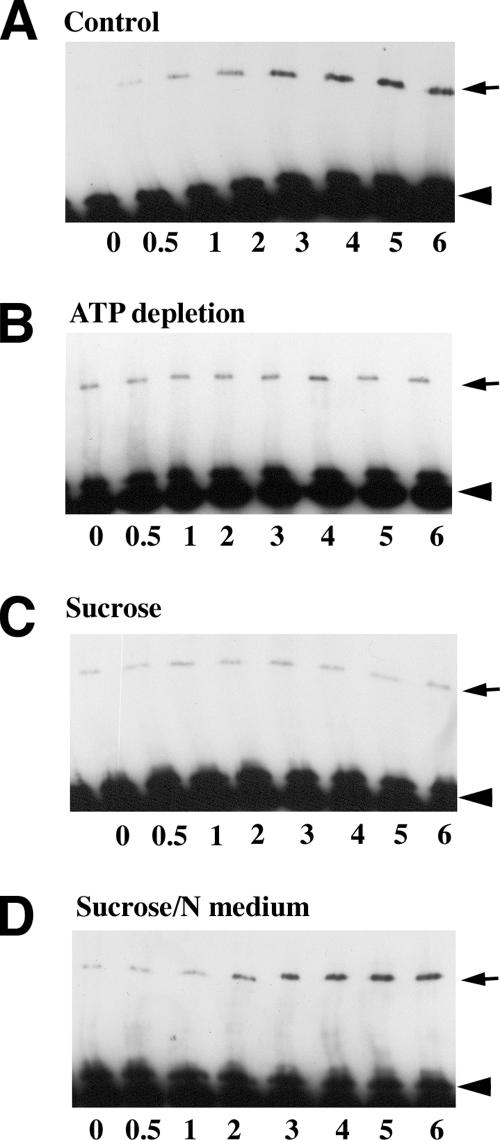
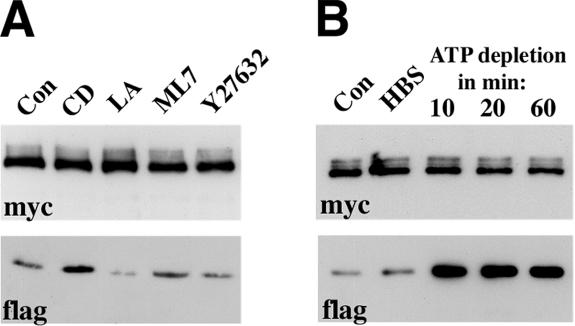
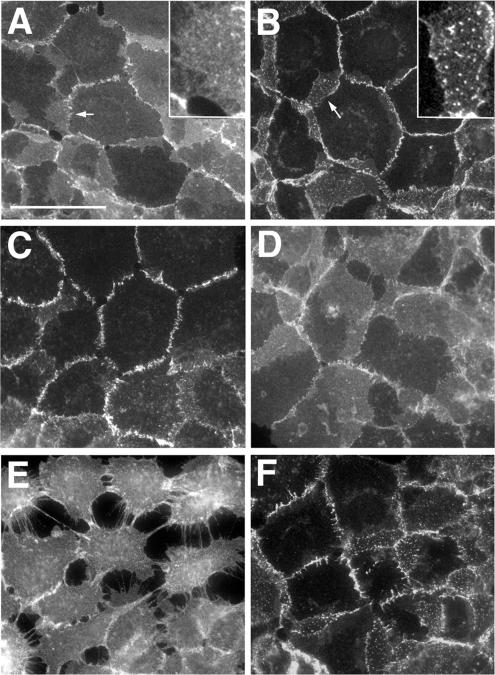
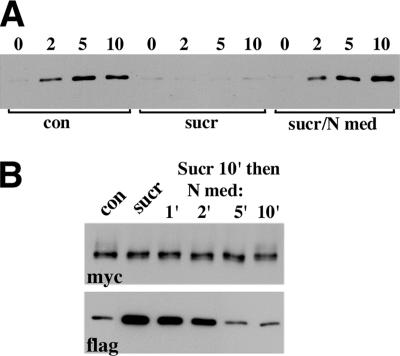
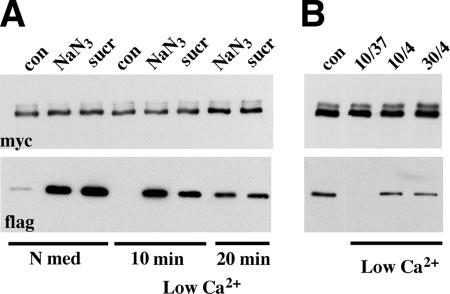
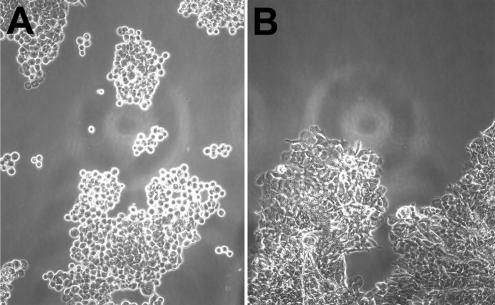
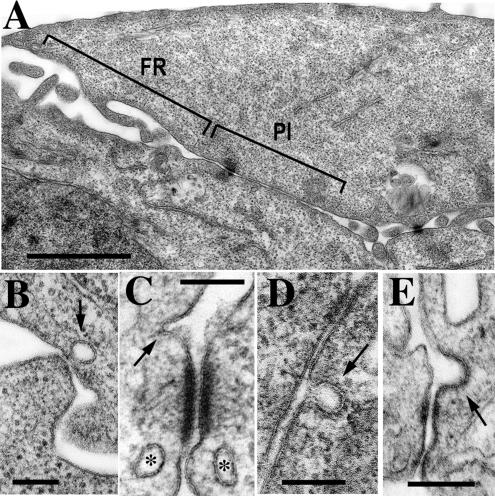
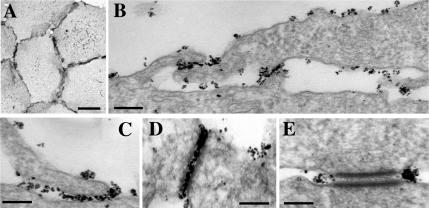
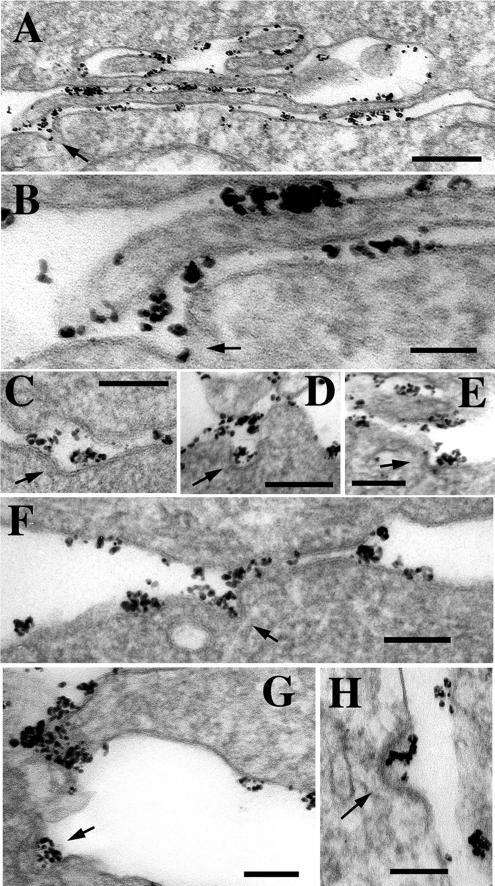
The adhesion receptor E-cadherin maintains cell-cell junctions by continuously forming short-lived adhesive dimers. Here mixed culture cross-linking and coimmunoprecipitation assays were used to determine the dynamics of adhesive dimer assembly. We showed that the amount of these dimers increased dramatically minutes after the inhibition of endocytosis by ATP depletion or by hypertonic sucrose. This increase was accompanied by the efficient recruitment of E-cadherin into adherens junctions. After 10 min, when the adhesive dimer amount had reached a plateau, the assembly of new dimers stalled completely. These cells, in a striking difference from the control, became unable to disintegrate both their intercellular contacts and adhesive dimers in response to calcium depletion. The same effects, but after a slightly longer time course, were obtained using acidic media, another potent approach inhibiting endocytosis. These data suggest that endocytosis is the main pathway for the dissociation of E-cadherin adhesive dimers. Its inhibition blocks the replenishment of the monomeric cadherin pool, thereby inhibiting new dimer formation. This suggestion has been corroborated by immunoelectron microscopy, which revealed cadherin-enriched coated pit-like structures in close association with adherens junctions.


Figures

Figure 1.
Figure 1.
(A) The backbone structure of N-cadherin EC1 domain strand dimer according to Shapiro et al. (1995), as viewed from the carboxyl-termini. The side chains of the residues corresponding to E-cadherin T227 (yellow) and W213 (green) are shown. Left panel, cysteines, when occupy the T227 position, are located at the opposite sides of the strand dimer that makes their cross-linking difficult. In contrast, the heterodimer consisting of T227C and W213C mutants (right panel) exposes two closely opposed cysteines. (B) Schematic representation of our experiment. Brief treatment of the A227M/A213F coculture with the cysteine-specific cross-linker (red dots) should cross-link a low amount of adhesive dimers and interact via one reactive group with some fraction of the monomeric Ec227M and Ec213F mutants (left panel, 0). The subsequent adhesive dimerization of so-labeled mutants with their unlabeled counterparts would result in the cross-linking reaction (right panel). (C) Homogeneous culture of A227M cells (lane M) and a mixed culture of A227M and A213F cells (lane M/F) were cross-linked by BM[PEO]3 (1 mg/ml, 5 min at RT). Their total lysates were analyzed by Western blotting with anti-myc antibody. Note that cross-linked dimers (arrow) are produced only in coculture. Monomeric form is indicated by arrowhead. (D) A227M and A213F cells (lanes M and F, respectively) were first labeled with the cysteine-specific cross-linker DPDPB (50 μg/ml, RT; times of labeling are indicated under corresponding lanes). Residual unlabeled cysteines were then biotinylated by maleimide-biotin surface labeling. Western blot was developed using streptavidin-peroxidase. Myc- and flag-tagged mutants are indicated by the arrow and arrowhead, respectively. Note that E-cadherin mutants are the predominant biotinylated proteins, and 30-s long DPDPB pulse-labeling does not notably deplete surface-exposed thiol groups. Molecular weight markers (from top to bottom: 116, 97.4, 67, and 45 kDa) are shown by horizontal bars. (E) After being DPDPB pulse-labeled (50 μg/ml, 30 s), the A227M/A213F mixed cultures were solubilized for Western blot, either immediately (lane 0) or after 5-min chase (lane 5). Cells were chased at either 37°C (lanes C/37°) or at 4°C (lanes C/4°). Before pulse-labeling cells were pretreated with 0.05% digitonin (lanes D/37°). Note that low temperature or digitonin block the cross-linking reaction. (F) Cell–cell contacts in A227M/A213F mixed cultures were disrupted by low calcium. Cells were then DPDPB pulse-labeled and either immediately chased in a high-calcium medium (lanes LC/Chase) or the chase was applied after a 5-min (LC/5-LC/Chase) or 10-min (LC/10-LC/Chase)-long incubation in low calcium. The resulting cell lysates were analyzed by anti-myc. Chase durations in minutes are indicated below the lanes.
Figure 2.
Figure 2.
The kinetics of adhesive dimer assembly under various experimental conditions. A227M/A213F mixed cultures were DPDPB pulse-labeled and then chased in cysteine-free media for different time periods (indicated in min below the lanes). Total cell lysates were analyzed by anti-myc Western blotting. The arrows and arrowheads indicate cross-linked dimers and monomers, respectively. (A) Cells were chased in control media; (B) cells were depleted of ATP (for 10 min) and then were pulse-labeled and chased in the presence of metabolic inhibitors; (C) cells were pretreated with hypertonic sucrose (for 10 min) and then pulse-labeled and chased with buffers also containing hypertonic sucrose; (D) cells were pretreated and pulse-labeled in hypertonic sucrose and then chased in the regular medium. Notably, the level of the cross-linked dimers under control conditions reached a plateau within 3 min after labeling. Both ATP depletion and hypertonic media blocked the cross-linking kinetics. Normal media added to the sucrose-treated cells immediately restored adhesive dimer assembly.
Figure 3.
Figure 3.
(A) Effects of various actin inhibitors on the total level of adhesive dimers. CD, cytochalasin D; LA, Latrunculin A; ML7, ML-7, Y27632, Y-27632; Con, control cells. Overnight AEcM/AEcF cocultures were treated by different inhibitors for 20 min and then were immunoprecipitated by an anti-myc antibody. The blots were probed for the presence of the immunoprecipitated Ec1M (myc) or coimmunoprecipitated Ec1F (flag). The latter could derive only from adhesive Ec1M-Ec1F dimers. (B) Effect of ATP depletion on the adhesive dimers. Overnight AEcM/AEcF cocultures were incubated in HBS buffer supplemented with glucose for 20 min (HBS), or in HBS buffer containing metabolic inhibitors for 10, 20, or 60 min (indicated above the lanes).
Figure 4.
Figure 4.
Immunofluorescence microscopy of wild-type A-431 cells stained with the HECD-1 anti-E-cadherin antibody. (A) Control cells. Before being fixed, the cells were (B) depleted of ATP for 10 min; (C) treated with hypertonic sucrose for 10 min; (D) treated as in C and then returned for 4 min to the regular media; (E) incubated in low calcium for 10 min; or (F) treated as in C and then transferred to the low-calcium hypertonic medium for 10 min. Higher magnifications of the selected regions (indicated by arrows) are shown in the insets. Note that hypertonic sucrose concentrated E-cadherin into the more discernible plaques and protected the cell–cell dissociation in low calcium. Bar, 50 μm.
Figure 5.
Figure 5.
Effects of the hypertonic medium on E-cadherin internalization and E-cadherin adhesive dimers. (A) A-431 cells were surface-biotinylated at 4°C (lane 0), chased at 37°C (chase periods in min are indicated above the lanes), glutathione-stripped, and solubilized. Internalized proteins, which are still biotinylated, were precipitated by streptavidin beads and analyzed using an anti-E-cadherin antibody. (Con) cells were biotinylated and chased in normal conditions; (sucr) cells were preincubated (for 20 min), labeled, and chased in the hypertonic medium; (sucr/N med) cells were preincubated in the hypertonic sucrose but biotinylated and chased in the regular medium. (B) Effect of the hypertonic medium on adhesive dimers. The control AEc1M/AEc1F coculture (lane con) or after it has been treated with hypertonic sucrose (lane sucr) were analyzed by the mixed culture coimmunoprecipitation assay (see the legend for Figure 3 for detail). Note that hypertonic sucrose strongly elevated the level of adhesive dimers. When the cocultures were transferred to normal media (for 1, 2, 5, 10 min, as indicated above the lanes) after 10-min-long sucrose treatment, the amount of adhesive dimers rapidly reverted to the normal level.
Figure 6.
Figure 6.
ATP depletion, hypertonic sucrose, and low temperature protect adhesive dimers from dissociation in low calcium. (A) The control AEc1M/AEc1F coculture (lane con) or the cocultures after a 10 min-long administration of metabolic inhibitors (lane NaN3) or hypertonic sucrose (lane sucr) were incubated for an additional 10 or 20 min (indicated below the lanes), with the same inhibitors but at low calcium. Cell lysates were processed as indicated in Figure 3. Note that when cadherin dynamics were blocked by ATP depletion or hypertonic sucrose, a high level of adhesive dimers remained even after 20-min-long incubation with a low-calcium medium. (B) AEc1M/AEc1F cocultures were incubated in low-calcium media at 37°C for 10 min (lane 37/10), or at 4°C for 10 or for 30 min (lanes 4/10 or 4/30, respectively). Cell lysates were processed as above.
Figure 7.
Figure 7.
Hypertonic sucrose protects epithelial sheets from disintegration. Control (A) and sucrose-treated (B) monolayers were disattached from cell substrates via incubation with trypsin in the presence of calcium. After inactivation of trypsin, monolayers were transferred into EDTA-containing media and were shaken in bacterial shaker for 20 min (100 rpm at 37°C). Note that control but not sucrose-treated monolayers breakdown to small aggregates or single cells. Also note striking differences in the morphology of individual cells in the aggregates. In the control case (A) aggregates consist of loosely connected rounded cells, whereas cells are tightly packed in the case of hypertonic sucrose (B).
Figure 8.
Figure 8.
(A) A general view of an A-431 cell–cell interface by conventional transmission EM. The interface consists of the two morphologically distinct regions, a filopodia-reach (FR) region and a parallel interface (PI) region. Bar, 1.5 μm. (B–E) Presumptive endocytic vesicles (indicated by arrows) are frequently pinched off from various cell–cell contact junctions within both regions: at the sites of interactions with filopodia (B), in close association with a desmosome (C), or an adherens-like junction (E), or within PI region (D). Asterisks in C mark two fully formed vesicles in close proximity to the desmosome. Bars, 200 nm.
Figure 9.
Figure 9.
Anti-E-cadherin immunogold labeling of A-431 cells. The cells, which were gold-labeled, silver-enhanced, and gold-toned, were analyzed either under light microscope (A) or under EM (B–E). E-cadherin was revealed on the cell–cell junction-free cellular surface as small clusters of gold particles each of which apparently represented a single cadherin molecule. Individual E-cadherin molecules were clustered in sites of cell–cell contacts: in the sites of filopodia–cell interaction (C), in adherens junctions (D), and around desmosomes (E). Bars, 20 μm (in A), 200 nm (in B), 100 nm (in C–E).
Figure 10.
Figure 10.
Anti-E-cadherin immunogold EM that detects endocytic E-cadherin–containing invaginations within various types of cell–cell junctions. (A) Low magnification (bar, 0.4 μm) of a FR region. An arrow indicates a presumptive endocytic invagination occurring in the site where a cell interacts with a tip of a filopodia. The enlargement of this site is presented in B. (C–F) Several other examples of cadherin-containing invaginations (arrows) within cadherin-containing junctions. The micrograph shown in F presents an adherens junction in HaCaT cells. (G and H) Cadherin endocytosis (arrows) was also frequently detected in cell–cell contact-free areas. Bars (B–H), 100 nm. Note that in all cases the size of invaginations is similar to that of clathrin-coated pits (100 nm), whereas only in D is the coat clearly visible.

References

    1. Adams C. L., Chen Y. T., Smith S. J., Nelson W. J. Mechanisms of epithelial cell-cell adhesion and cell compaction revealed by high-resolution tracking of E-cadherin-green fluorescent protein. J. Cell Biol. 1998;142:1105–1119. - PMC - PubMed
    1. Akhtar N., Hotchin N. A. RAC1 regulates adherens junctions through endocytosis of E-cadherin. Mol. Biol. Cell. 2001;12:847–862. - PMC - PubMed
    1. Boggon T. J., Murray J., Chappuis-Flament S., Wong E., Gumbiner B. M., Shapiro L. C-cadherin ectodomain structure and implications for cell adhesion mechanisms. Science. 2002;296:1308–1313. - PubMed
    1. Bryant D. M., Stow J. L. The ins and outs of E-cadherin trafficking. Trends Cell Biol. 2004;14:427–434. - PubMed
    1. Chitaev N. A., Troyanovsky S. M. Adhesive but not lateral E-cadherin complexes require calcium and catenins for their formation. J. Cell Biol. 1998;142:837–846. - PMC - PubMed

Publication types

MeSH terms