Comparative Study
. 2007 Feb;28(2):143-57.
doi: 10.1002/hbm.20263.

Comparison of different cortical connectivity estimators for high-resolution EEG recordings

Affiliations
Comparative Study

Comparison of different cortical connectivity estimators for high-resolution EEG recordings

Laura Astolfi et al. Hum Brain Mapp. 2007 Feb.

Abstract

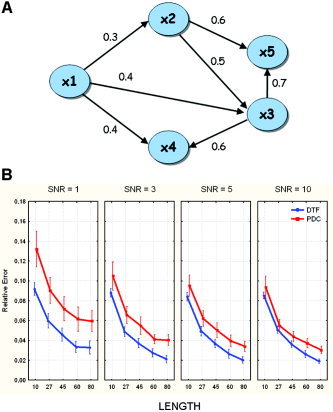
The aim of this work is to characterize quantitatively the performance of a body of techniques in the frequency domain for the estimation of cortical connectivity from high-resolution EEG recordings in different operative conditions commonly encountered in practice. Connectivity pattern estimators investigated are the Directed Transfer Function (DTF), its modification known as direct DTF (dDTF) and the Partial Directed Coherence (PDC). Predefined patterns of cortical connectivity were simulated and then retrieved by the application of the DTF, dDTF, and PDC methods. Signal-to-noise ratio (SNR) and length (LENGTH) of EEG epochs were studied as factors affecting the reconstruction of the imposed connectivity patterns. Reconstruction quality and error rate in estimated connectivity patterns were evaluated by means of some indexes of quality for the reconstructed connectivity pattern. The error functions were statistically analyzed with analysis of variance (ANOVA). The whole methodology was then applied to high-resolution EEG data recorded during the well-known Stroop paradigm. Simulations indicated that all three methods correctly estimated the simulated connectivity patterns under reasonable conditions. However, performance of the methods differed somewhat as a function of SNR and LENGTH factors. The methods were generally equivalent when applied to the Stroop data. In general, the amount of available EEG affected the accuracy of connectivity pattern estimations. Analysis of 27 s of nonconsecutive recordings with an SNR of 3 or more ensured that the connectivity pattern could be accurately recovered with an error below 7% for the PDC and 5% for the DTF. In conclusion, functional connectivity patterns of cortical activity can be effectively estimated under general conditions met in most EEG recordings by combining high-resolution EEG techniques, linear inverse estimation of the cortical activity, and frequency domain multivariate methods such as PDC, DTF, and dDTF.


Figures

Figure 1
Figure 1
A: Connectivity model imposed in the generation of simulated signals. Values on the arrows represent the connection strengths. B: Results of the ANOVA performed on the relative error made in the estimation of the connectivity flows. The diagram shows the influence of the different levels of the main factors SNR and LENGTH on the estimation of the correct flows in the connection graph employed for the simulation for the two estimators DTF and PDC. The bar on each point represents the 95% confidence interval of the mean errors computed across the simulations. Duncan post‐hoc test (performed at 5%) showed no significant difference between levels 3, 5, and 10 of factor SNR. [Color figure can be viewed in the online issue, which is available at www.interscience.wiley.com.]
Figure 2
Figure 2
A: Connectivity model imposed on the simulated signals. The thick arrows represent the indirect pathways linking the cortical areas. B: Average connectivity values estimated on two indirect links (1→5 and 2→4) and for all the other existing arcs for the networks by the three methods DTF, PDC, and dDTF during all the simulations. [Color figure can be viewed in the online issue, which is available at www.interscience.wiley.com.]
Figure 3
Figure 3
Over the right hemisphere the electrode montage (59 electrodes) is shown on the realistic reconstruction of a subject's scalp, obtained from structural MRIs. Over the left hemisphere the ROIs considered for this study are shown on the realistic reconstruction of the subject's cortex. Each ROI is represented in a different color. The ROIs considered are the cingulate motor area (CMA), Brodmann areas 7 (A7) and 5 (A5), the primary motor area the posterior supplementary motor area (SMAp) and the lateral supplementary motor area (A6_L). [Color figure can be viewed in the online issue, which is available at www.interscience.wiley.com.]
Figure 4
Figure 4
Cortical connectivity patterns obtained for the period preceding the subject's response during congruent trials in the beta (12–29 Hz) frequency band in a representative subject. The patterns are shown on the realistic head model and cortical envelope of the subject, obtained from sequential MRIs. The brain is seen from above, left hemisphere represented on the right side. Functional connections are represented with arrows that move from a cortical area toward another one. The arrows' colors and sizes code the strengths of the connections. The lighter and the bigger the arrows, the stronger the connections. Three connectivity patterns are depicted, estimated in the beta frequency band for the same subject with the DTF (left), the PDC (middle), and the dDTF (right). Only the cortical connections statistically significant at P < 0.01 are reported. [Color figure can be viewed in the online issue, which is available at www.interscience.wiley.com.]
Figure 5
Figure 5
The inflow (first row) and the outflow (second row) patterns obtained for the beta frequency band from each ROI during the congruent trials. The brain is seen from above, left hemisphere represented on the right side. In the first row the figure summarizes in red hues the behavior of an ROI in terms of reception of information flow from other ROIs, by adding the values of the links arriving on the particular ROI from all the others. The information is coded with the size and the color of a sphere centered on the particular ROI analyzed. The larger the sphere, the higher the value of inflow or outflow for any given ROI. In the second row the blue hues code the outflow of information from a single ROI towards all the others. [Color figure can be viewed in the online issue, which is available at www.interscience.wiley.com.]

References

    1. Akaike H (1974): A new look at statistical model identification. IEEE Trans Automat Control AC‐ 19: 716–723.
    1. Astolfi L, Cincotti F, Babiloni C, Carducci F, Basilisco A, Rossini PM, Salinari S, Mattia D, Cerutti S, Ben Dayan D, Ding L, Ni Y, He B, Babiloni F (2005a): Estimation of the cortical connectivity by high‐resolution EEG and structural equation modeling: simulations and application to finger tapping data. IEEE Trans Biomed Eng 52: 757–768. - PubMed
    1. Astolfi L, Cincotti F, Mattia D, Babiloni C, Carducci F, Basilisco A, Rossini PM, Salinari S, Ding L, Ni Y, He B, Babiloni F (2005b): Assessing cortical functional connectivity by linear inverse estimation and directed transfer function: simulations and application to real data. Clin Neurophysiol 116: 920–932. - PubMed
    1. Babiloni F, Babiloni C, Locche L, Cincotti F, Rossini PM, Carducci F (2000): High‐resolution electroencephalogram: source estimates of Laplacian‐transformed somatosensory‐evoked potentials using a realistic subject head model constructed from magnetic resonance images. Med Biol Eng Comput 38: 512–519. - PubMed
    1. Babiloni F, Carducci F, Cincotti F, Del Gratta C, Pizzella V, Romani GL, Rossini PM, Tecchio F, Babiloni C (2001): Linear inverse source estimate of combined EEG and MEG data related to voluntary movements. Hum Brain Mapp 14: 197–209. - PMC - PubMed

Publication types