Comparative Study
. 2006 Jun;208(6):709-24.
doi: 10.1111/j.1469-7580.2006.00563.x.

Morphological analysis of the hindlimb in apes and humans. I. Muscle architecture

Affiliations
Comparative Study

Morphological analysis of the hindlimb in apes and humans. I. Muscle architecture

R C Payne et al. J Anat. 2006 Jun.

Abstract

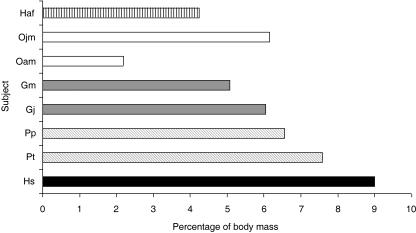
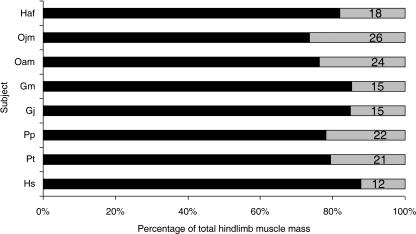
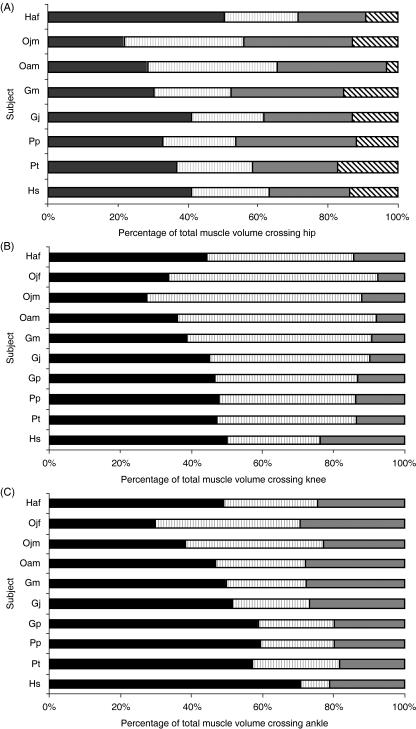
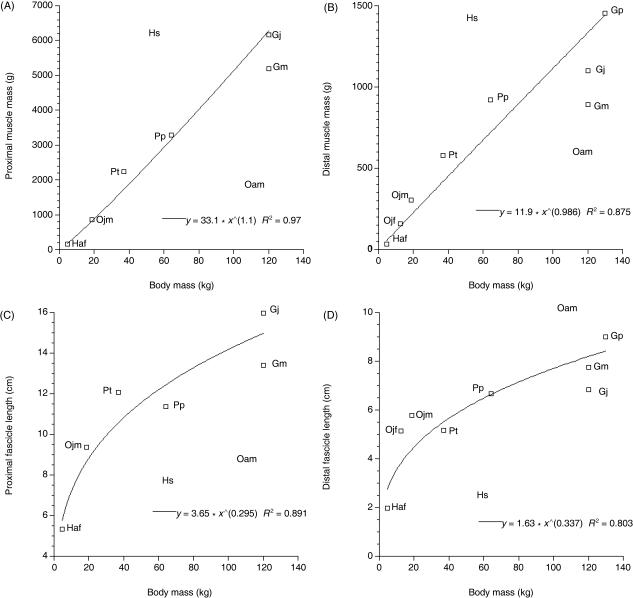
We present quantitative data on the hindlimb musculature of Pan paniscus, Gorilla gorilla gorilla, Gorilla gorilla graueri, Pongo pygmaeus abelii and Hylobates lar and discuss the findings in relation to the locomotor habits of each. Muscle mass and fascicle length data were obtained for all major hindlimb muscles. Physiological cross-sectional area (PCSA) was estimated. Data were normalized assuming geometric similarity to allow for comparison of animals of different size/species. Muscle mass scaled closely to (body mass)(1.0) and fascicle length scaled closely to (body mass)(0.3) in most species. However, human hindlimb muscles were heavy and had short fascicles per unit body mass when compared with non-human apes. Gibbon hindlimb anatomy shared some features with human hindlimbs that were not observed in the non-human great apes: limb circumferences tapered from proximal-to-distal, fascicle lengths were short per unit body mass and tendons were relatively long. Non-human great ape hindlimb muscles were, by contrast, characterized by long fascicles arranged in parallel, with little/no tendon of insertion. Such an arrangement of muscle architecture would be useful for locomotion in a three dimensionally complex arboreal environment.


Figures

Fig. 1
Fig. 1
Comparative limb proportions in hominoids [Figure taken from Schultz AH (1969) The Life of Primates, London: Weidenfield and Nicholson. All attempts at tracing the copyright holder of the figure were unsuccessful].
Fig. 2
Fig. 2
Photographic images of the hindlimb in (A) the bonobo (Pp) and (B) the gibbon (Haf) hindlimb. The dermis has not been removed from the bonobo hindlimb.
Fig. 3
Fig. 3
Hindlimb muscle mass as a percentage of body mass. Subject name abbreviations are as detailed in Table 1. Total hindlimb muscle mass does not include either small intrinsic hip rotator muscles (piriformis, quadratus femoris, obturator externus, obturator internus, piriformis) or intrinsic pedal muscles. Subjects have been colour coded for ease of comparison: gibbon (black horizontal stripes), orang-utan (white), gorilla (dark grey), chimpanzee (diagonal stripes), human (black). Subjects Gm and Ojf have not been included in this comparison as muscles crossing the hip joint were incomplete in these subjects.
Fig. 4
Fig. 4
Distribution of muscle mass between the proximal and distal hindlimb. Subject name abbreviations are as detailed in Table 1. Percentage of proximal limb muscle mass is depicted in grey and percentage of distal limb muscle mass is depicted in black. Total hindlimb muscle mass does not include the small intrinsic hip rotator muscles (piriformis, quadratus femoris, obturator externus, obturator internus, piriformis) or intrinsic pedal muscles.
Fig. 5
Fig. 5
Contribution of functional muscle groups to total muscle volume crossing (A) hip, (B) knee and (C) ankle joints. Muscle groups are coloured coded as follows: (A) gluteals (black), hamstrings (grey vertical stripe), adductors (grey), hip flexors (black diagonal stripe); (B) rectus femoris and vastus (black), hamstrings (grey vertical stripe) and triceps (grey); (C) triceps (black), digital flexors (grey vertical stripe), dorsiflexors (grey). Ojf and Gp did not have a full set of hip joint musculature so they are not included in hip joint analysis. Data were not available for rectus femoris in humans. Instead, proportions were estimated by assuming that human rectus femoris represents the same proportion of the quadriceps muscle group as in the common chimpanzee (17%).
Fig. 6
Fig. 6
Plots to show the relationship between muscle mass and body mass in proximal (A) and distal (B) limb muscle groups and mean fascicle length and body mass in proximal (C) and distal (D) limb muscle groups. Power trend lines have been fitted to the data and their equations are provided on the plots. All R2 values were significant (P = 0.05). Mean proximal and distal muscle group fascicle lengths were calculated as a weighted harmonic mean (see Methods). Human (Hs) and adult orang-utan (Oam) data were not included in the analysis. However, their position is marked on each plot by name for reference.

References

    1. Aerts P. Vertical jumping in Galago senegalensis: the quest for a hidden power amplifier. Phil Trans R Soc Lond. 1998;353:1607–1620.
    1. Aerts P, Van Damme R, Van Elsacker L, Duchene V. Spatio-temporal gait characteristics of hind-limb cycles during voluntary bipedal and quadrupedal walking in bonobos (Pan paniscus). Am J Phys Anthropol. 2000;111:503–517. - PubMed
    1. Aiello LC, Wheeler P. The expensive-tissue hypothesis. Curr Anthropol. 1995;36:199–221.
    1. Aiello LC, Wells JCK. Energetics and the evolution of the genus Homo. Annu Rev Anthropol. 2002;31:323–338.
    1. Alexander RM, Vernon A. The dimensions of the knee and ankle muscles and the forces they exert. J Hum Mov Stud. 1975;1:115–123.

Publication types