

Centering, scaling, and transformations: improving the biological information content of metabolomics data
- PMID: 16762068
- PMCID: PMC1534033
- DOI: 10.1186/1471-2164-7-142
Centering, scaling, and transformations: improving the biological information content of metabolomics data
Abstract
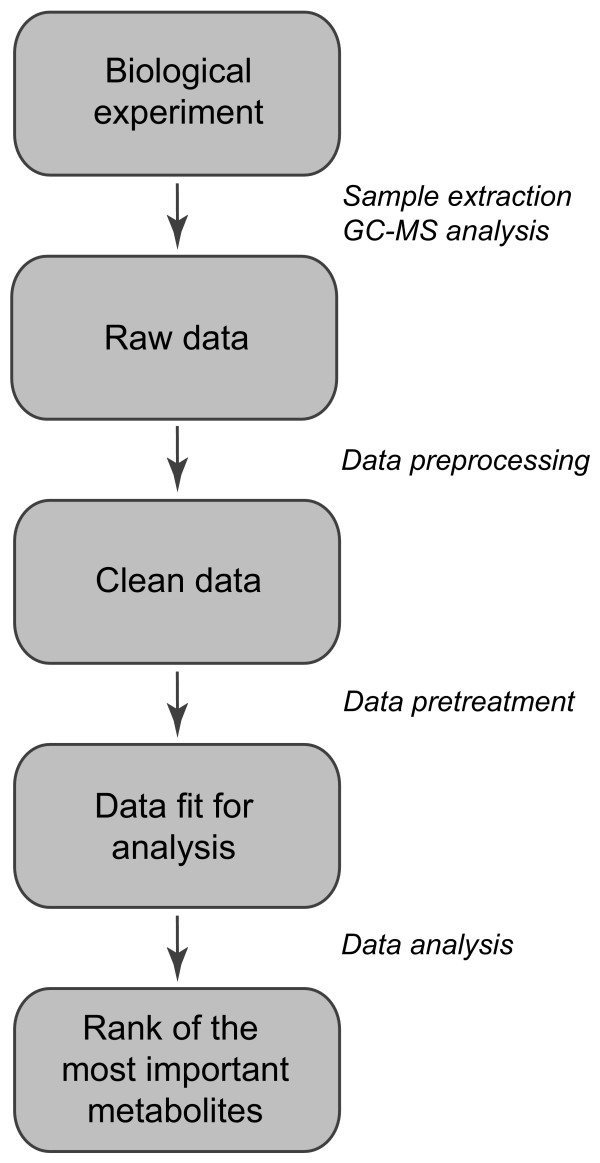
Background: Extracting relevant biological information from large data sets is a major challenge in functional genomics research. Different aspects of the data hamper their biological interpretation. For instance, 5000-fold differences in concentration for different metabolites are present in a metabolomics data set, while these differences are not proportional to the biological relevance of these metabolites. However, data analysis methods are not able to make this distinction. Data pretreatment methods can correct for aspects that hinder the biological interpretation of metabolomics data sets by emphasizing the biological information in the data set and thus improving their biological interpretability.
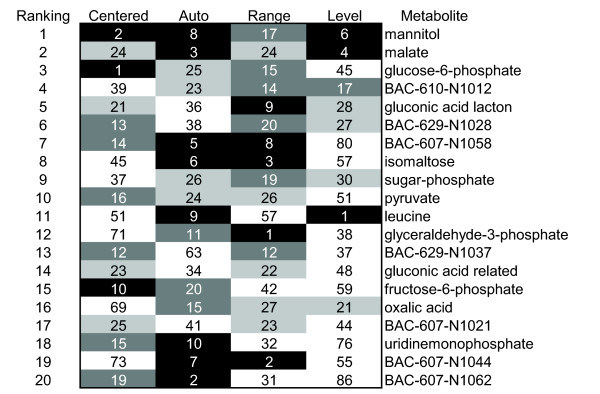
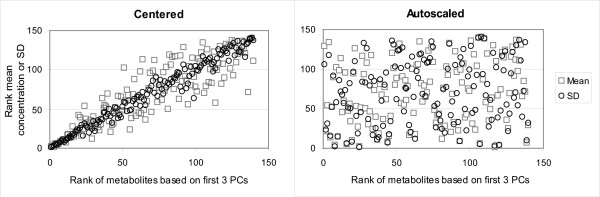
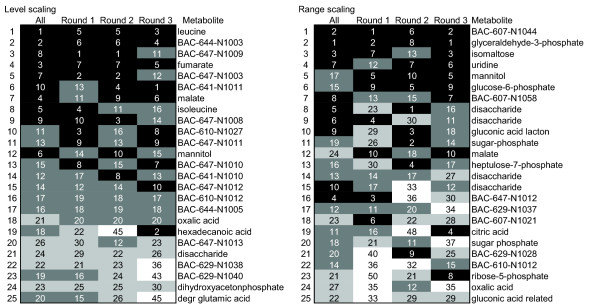
Results: Different data pretreatment methods, i.e. centering, autoscaling, pareto scaling, range scaling, vast scaling, log transformation, and power transformation, were tested on a real-life metabolomics data set. They were found to greatly affect the outcome of the data analysis and thus the rank of the, from a biological point of view, most important metabolites. Furthermore, the stability of the rank, the influence of technical errors on data analysis, and the preference of data analysis methods for selecting highly abundant metabolites were affected by the data pretreatment method used prior to data analysis.
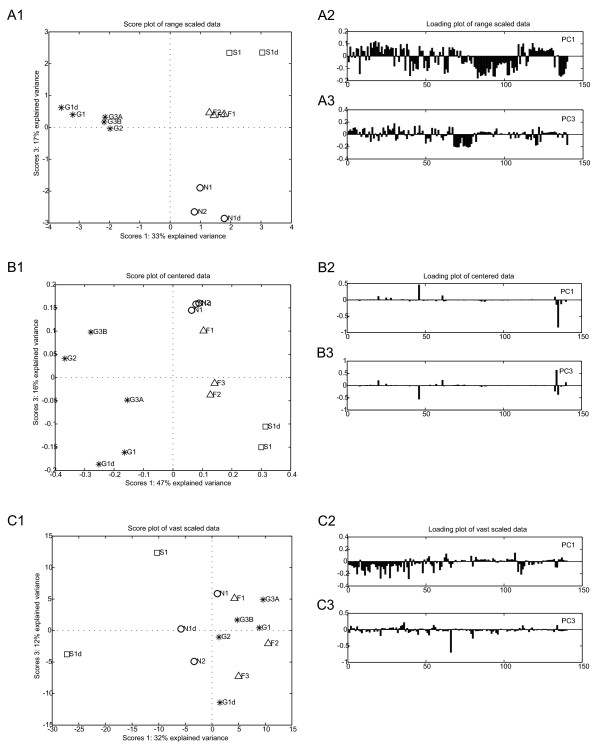
Conclusion: Different pretreatment methods emphasize different aspects of the data and each pretreatment method has its own merits and drawbacks. The choice for a pretreatment method depends on the biological question to be answered, the properties of the data set and the data analysis method selected. For the explorative analysis of the validation data set used in this study, autoscaling and range scaling performed better than the other pretreatment methods. That is, range scaling and autoscaling were able to remove the dependence of the rank of the metabolites on the average concentration and the magnitude of the fold changes and showed biologically sensible results after PCA (principal component analysis).In conclusion, selecting a proper data pretreatment method is an essential step in the analysis of metabolomics data and greatly affects the metabolites that are identified to be the most important.
Figures
References
-
- Reis EM, Ojopi EPB, Alberto FL, Rahal P, Tsukumo F, Mancini UM, Guimaraes GS, Thompson GMA, Camacho C, Miracca E, Carvalho AL, Machado AA, Paquola ACM, Cerutti JM, da Silva AM, Pereira GG, Valentini SR, Nagai MA, Kowalski LP, Verjovski-Almeida S, Tajara EH, Dias-Neto E, Consortium HNA. Large-scale Transcriptome Analyses Reveal New Genetic Marker Candidates of Head, Neck, and Thyroid Cancer. Cancer Res. 2005;65:1693–1699. doi: 10.1158/0008-5472.CAN-04-3506. http://cancerres.aacrjournals.org/cgi/content/abstract/65/5/1693 - DOI - PubMed
-
- van der Werf MJ, Jellema RH, Hankemeier T. Microbial Metabolomics: replacing trial-and-error by the unbiased selection and ranking of targets. J Ind Microbiol Biotechnol. 2005;32:234–252. doi: 10.1007/s10295-005-0231-4. http://dx.doi.org/10.1007/s10295-005-0231-4 - DOI - PubMed
-
- Shurubor YI, Paolucci U, Krasnikov BF, Matson WR, Kristal BS. Analytical precision, biological variation, and mathematical normalization in high data density metabolomics. Metabolomics. 2005;1:75–85. doi: 10.1007/s11306-005-1109-1. - DOI
Publication types
MeSH terms
LinkOut - more resources
Full Text Sources
Other Literature Sources
Medical
