Comparative Study
. 2006 Jun 8:6:12.
doi: 10.1186/1472-6807-6-12.

Secondary structure spatial conformation footprint: a novel method for fast protein structure comparison and classification

Affiliations
Comparative Study

Secondary structure spatial conformation footprint: a novel method for fast protein structure comparison and classification

Elena Zotenko et al. BMC Struct Biol. .

Abstract

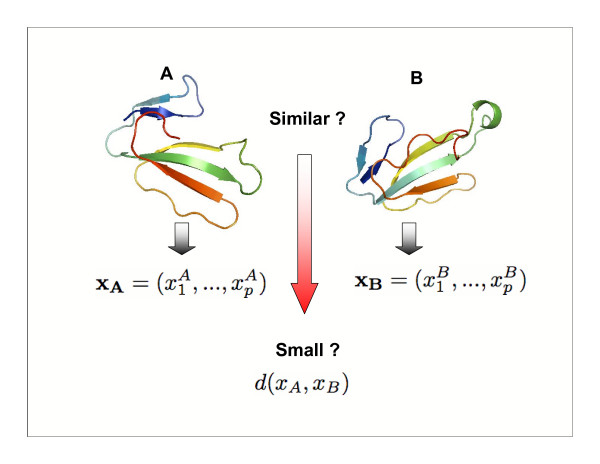
Background: Recently a new class of methods for fast protein structure comparison has emerged. We call the methods in this class projection methods as they rely on a mapping of protein structure into a high-dimensional vector space. Once the mapping is done, the structure comparison is reduced to distance computation between corresponding vectors. As structural similarity is approximated by distance between projections, the success of any projection method depends on how well its mapping function is able to capture the salient features of protein structure. There is no agreement on what constitutes a good projection technique and the three currently known projection methods utilize very different approaches to the mapping construction, both in terms of what structural elements are included and how this information is integrated to produce a vector representation.

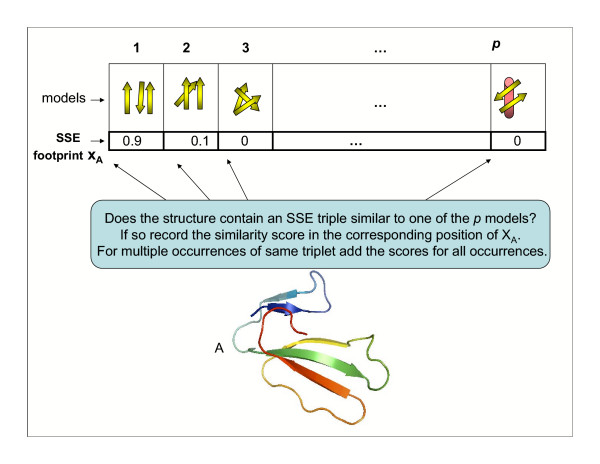
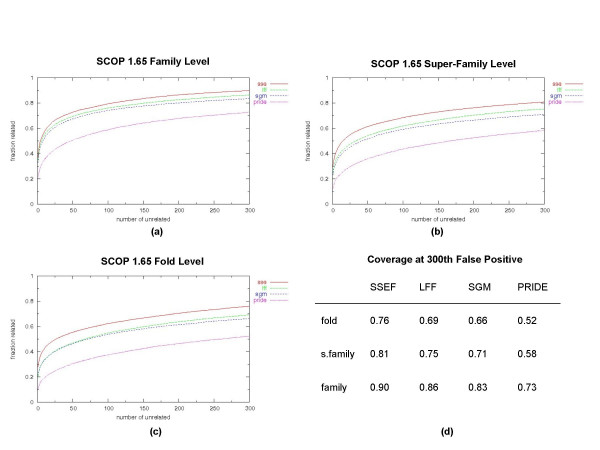
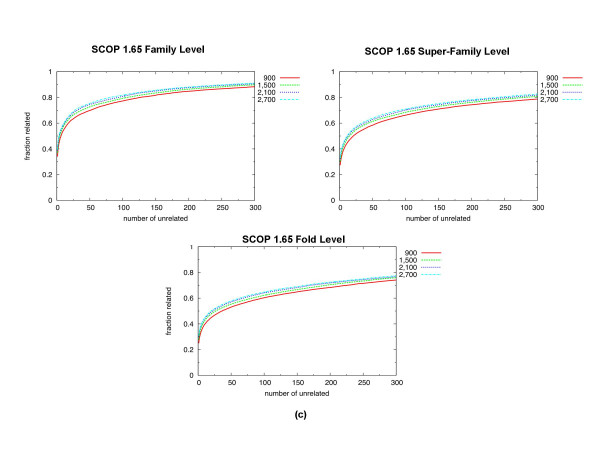
Results: In this paper we propose a novel projection method that uses secondary structure information to produce the mapping. First, a diverse set of spatial arrangements of triplets of secondary structure elements, a set of structural models, is automatically selected. Then, each protein structure is mapped into a high-dimensional vector of "counts" or footprint, where each count corresponds to the number of times a given structural model is observed in the structure, weighted by the precision with which the model is reproduced. We perform the first comprehensive evaluation of our method together with all other currently known projection methods.

Conclusion: The results of our evaluation suggest that the type of structural information used by a projection method affects the ability of the method to detect structural similarity. In particular, our method that uses the spatial conformations of triplets of secondary structure elements outperforms other methods in most of the tests.


Figures

Figure 1
Figure 1
Protein structure comparison via projection. To compare structures A and B, a projection method will first map them to a vector in a high-dimensional vector space. Thus, structure A is mapped to vector xA and structure B to xB. The structure comparison is then reduced to the distance computation between these vectors, i.e., the structures are similar if distance d(xA, xB) is small.
Figure 2
Figure 2
Computing an SSE footprint. Once a set of p models is selected, each protein domain is mapped to a vector in Rp, where each dimension corresponds to a particular model and records the "weighted" number of times the model is observed in the structure of the domain. Here a protein structure A is mapped to an SSE footprint xA.
Figure 3
Figure 3
Coverage versus error plots. Coverage versus Error plots for the SSEF, LFF, SGM, and PRIDE2 methods. Given a projection method and a database of protein domains, each query protein domain defines a curve, which plots coverage (the fraction of related protein domains retrieved) against the number of errors (the number of unrelated domains retrieved). To obtain one curve per projection method the individual curves were averaged, first across different queries in the same classification group and then across different classification groups (see Methods). (a) Pairs in the same SCOP family are true positives; pairs in different SCOP families are false positives. (b) Pairs in the same SCOP super-family are true positives; pairs in different SCOP super-families are false positives. (c) Pairs in the same SCOP fold are true positives; pairs in different SCOP folds are false positives. (d) Coverage obtained by projection methods at different classification levels when 300th false positive result is encountered.
Figure 4
Figure 4
Saturation of performance with the number of models. Coverage versus Error plots for our method with different number of models: 900, 1, 500, 2,100 and 2, 700 models. (a) Pairs in the same SCOP family are true positives; pairs in different SCOP families are false positives. (b) Pairs in the same SCOP super-family are true positives; pairs in different SCOP super-families are false positives. (c) Pairs in the same SCOP fold are true positives; pairs in different SCOP folds are false positives.

References

    1. Redfern O, Alastair G, Maibaum M, Orengo C. Survey of current protein family databases and their application in comparative, structural and functional genomics. J Chromatogr B Analyt Technol Biomed Life Sci. 2005;815:97–107. doi: 10.1016/j.jchromb.2004.11.010. - DOI - PubMed
    1. Murzin A, Brenner S, Hubbard T, Chotia C. SCOP: a structural classification of proteins database for the investigation of sequences and structures. J Mol Biol. 1995;247:536–540. doi: 10.1006/jmbi.1995.0159. - DOI - PubMed
    1. Orengo C, Michie A, Jones S, Jones D, Swindells M, Thornton J. CATH – A hierarchic classification of protein domain structures. Structure. 1997;5:1093–1108. doi: 10.1016/S0969-2126(97)00260-8. - DOI - PubMed
    1. Berman HM, Westbrook J, Feng Z, Gilliland G, Bhat TN, Weissig H, Shindyalov IN, Bourne PE. The Protein Data Bank. Nucleic Acids Res. 2000;28:235–242. doi: 10.1093/nar/28.1.235. - DOI - PMC - PubMed
    1. Nussinov R, Wolfson H. Efficient detection of three-dimensional structural motifs in biological macromolecules by computer vision techniques. Proc Natl Acad Sci USA. 1991;88:10495–10499. doi: 10.1073/pnas.88.23.10495. - DOI - PMC - PubMed

Publication types