Comparative Study
. 2006 Jun;130(7):2099-112.
doi: 10.1053/j.gastro.2006.03.020.

Metformin prevents alcohol-induced liver injury in the mouse: Critical role of plasminogen activator inhibitor-1

Affiliations
Comparative Study

Metformin prevents alcohol-induced liver injury in the mouse: Critical role of plasminogen activator inhibitor-1

Ina Bergheim et al. Gastroenterology. 2006 Jun.

Abstract

Background & aims: The biguanide drug metformin has recently been found to improve steatosis and liver damage in animal models and in humans with nonalcoholic steatohepatitis.

Methods: The aim of the present study was to determine whether metformin also prevents steatosis and liver damage in mouse models of acute and chronic alcohol exposure.

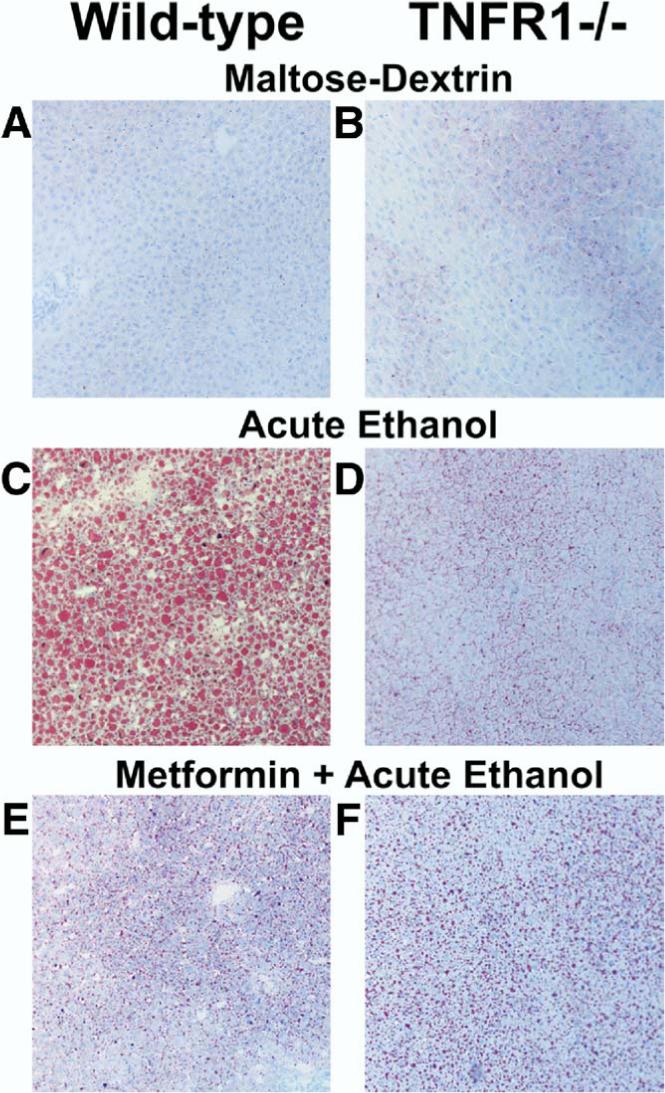
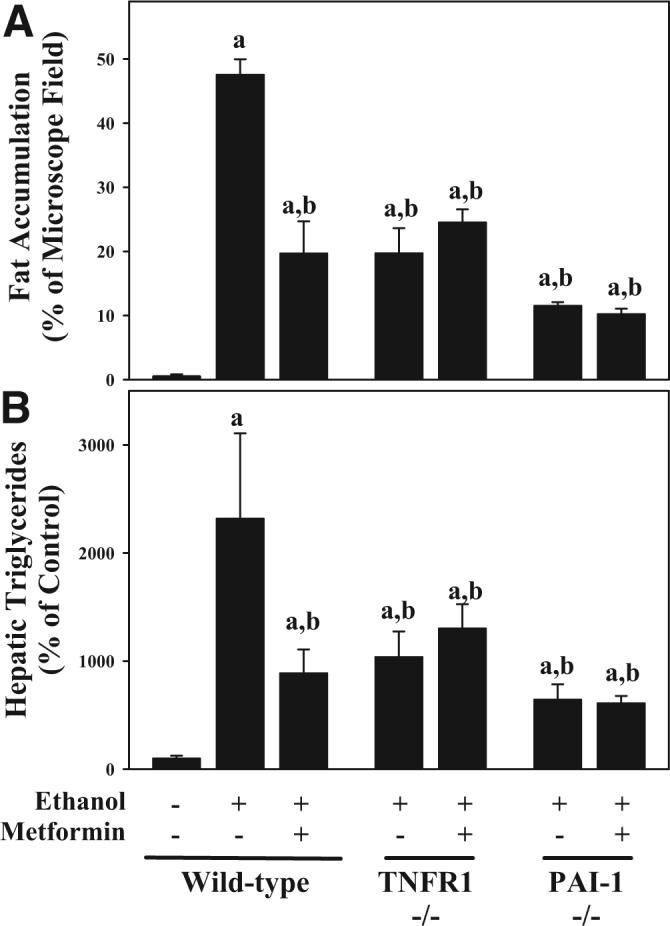
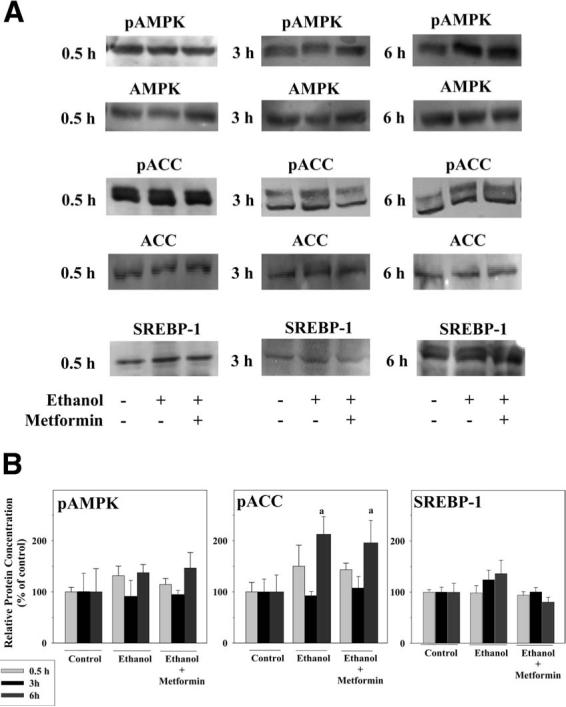
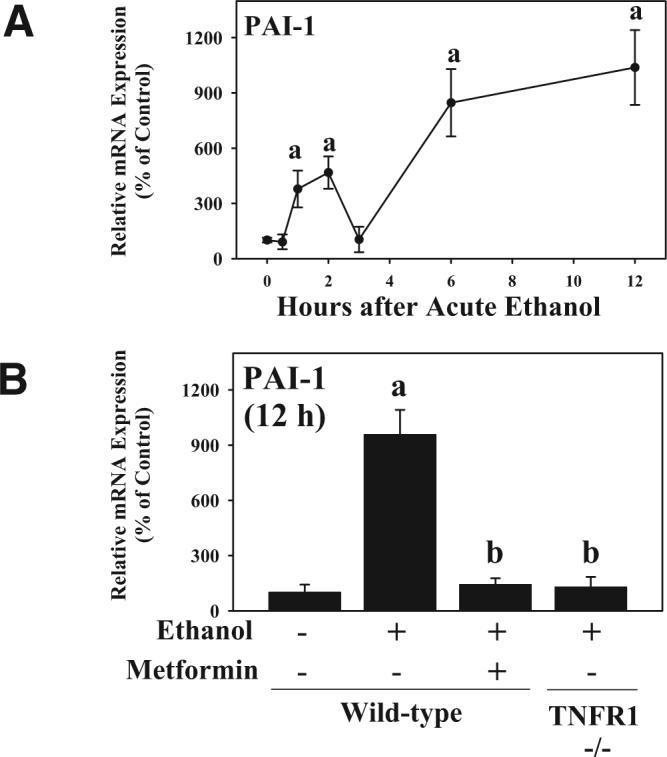
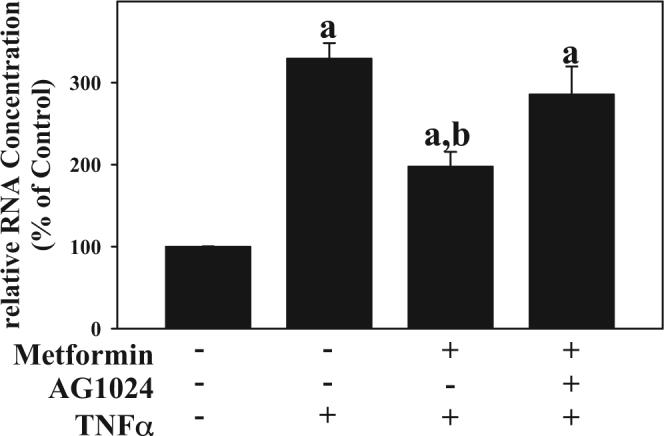
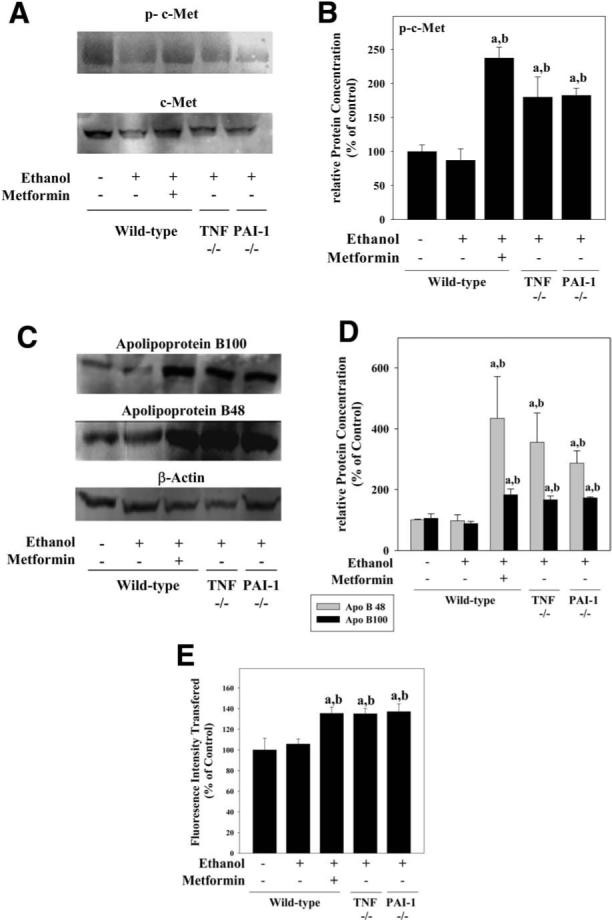
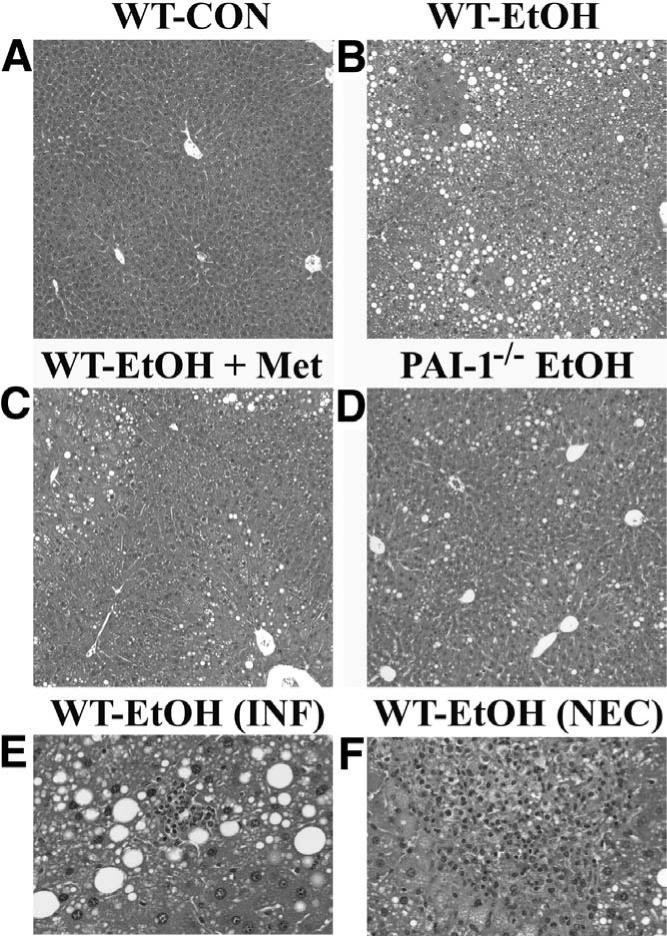
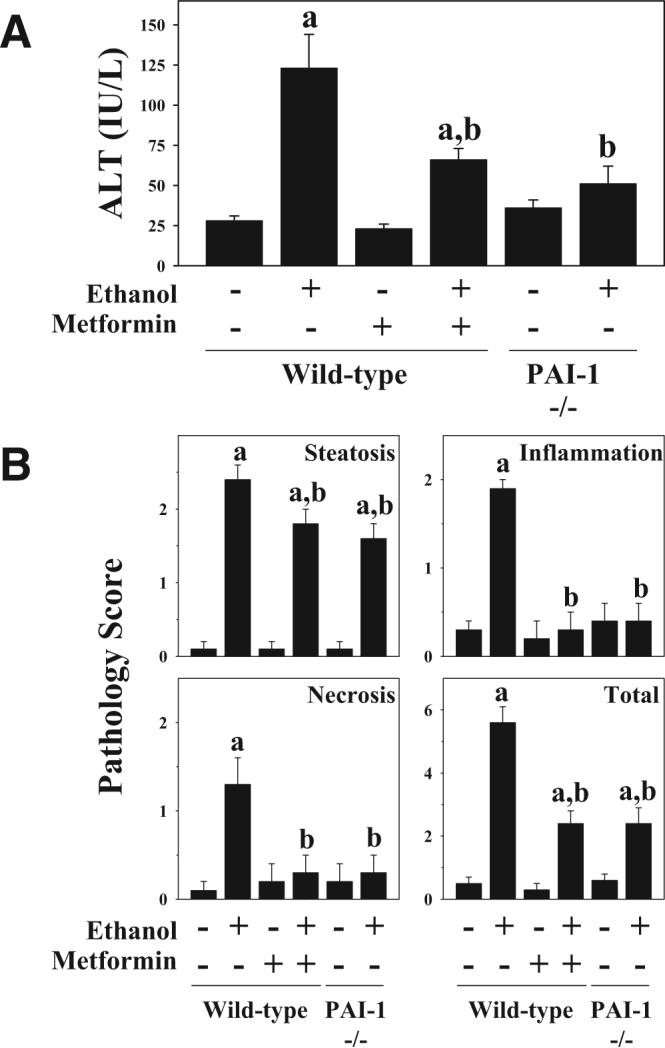
Results: Acute ethanol exposure caused a >20-fold increase in hepatic lipids, peaking 12 hours after administration. Metformin treatment significantly blunted the ethanol effect by >60%. Although metformin is a known inducer of AMP kinase (AMPK) activity, the hepatoprotective property of metformin did not correlate with activation of AMPK or of AMPK-dependent pathways. Instead, the protective effects of metformin correlated with complete prevention of the upregulation of plasminogen activator inhibitor (PAI)-1 caused by ethanol. Indeed, a similar protective effect against acute alcohol-induced lipid accumulation was observed in PAI-1-/- mice. Hepatic fat accumulation caused by chronic enteral ethanol feeding was also prevented by metformin or by knocking out PAI-1. Under these conditions, necroinflammatory changes caused by ethanol were also significantly attenuated.

Conclusions: Taken together, these findings suggest a novel mechanism of action for metformin and identify a new role of PAI-1 in hepatic injury caused by ethanol.


Figures

Figure 1
Figure 1
Effect of metformin on hepatic fat accumulation after acute ethanol ingestion in mice. Representative photomicrographs are shown depicting oil Red O staining of liver sections (200×) of wild-type and (E, F) TNFR1−/− mice given ethanol (EtOH) or isocaloric maltose-dextrin. Animals were either injected with 200 mg/kg metformin or saline prior to ethanol (maltose dextrin) administration. See Materials and Methods for details.
Figure 2
Figure 2
Quantitation of triglycerides and hepatic fat accumulation 12 hours after acute alcohol ingestion in mice. Animals and treatments are as described in Materials and Methods. Image analysis of lipid accumulation (A; see also Figure 1) and determination of hepatic triglycerides (B) were performed as described in Materials and Methods. Data are means ± SEM (n = 4−6) and are normalized to percent of control (A) or as percent of microscope field (B). aP < .05 compared with wild-type control; bP < .05 compared with wild-type ethanol-treated.
Figure 3
Figure 3
Effect of ethanol and metformin on the phosphorylation status of AMPK and ACC, as well as nuclear translocation of SREBP-1 after acute alcohol ingestion. Animals and treatments are as described in Materials and Methods. (A) Representative Western blots depicting phosphorylated and total AMPK and ACC, as well as nuclear localization of SREBP-1 0−6 hours after acute ethanol administration. (B) Results of quantitative analysis. Data are presented as mean values ± SEM and are normalized to percent of control (n = 4−6). aP < .05 compared with wild-type mice administered maltose dextrin.
Figure 4
Figure 4
Effect of ethanol and metformin on the expression of PAI-1 mRNA in liver. Animals and treatments are as described in Materials and Methods. Expression of PAI-1 mRNA was determined by real-time RT-PCR as described in Materials and Methods. (A) Expression of PAI-1 mRNA 0−12 hours after acute alcohol ingestion in wild-type mice. aP < .05 compared with t = 0 hours. (B) Effect of metformin or knocking out TNFR1 (TNFR1−/−) on the increase in PAI-1 expression caused by ethanol 12 hours after administration. Data are mean values ± SEM (n = 4−6). aP < .05 compared with wild-type mice administered maltose dextrin. bP < .05 compared with wild-type given ethanol.
Figure 5
Figure 5
Effect of metformin and tyrphostin-AG1024 on TNF-α–induced PAI-1 mRNA levels in AML-12 cells. AML-12 cells were pre-treated as described in Materials and Methods. PAI-1 mRNA levels were determined in cell culture samples using real-time RT-PCR. Data are mean values ± SEM and are normalized to percent of control. Quantitative analysis of 3 separate experiments. aP < .05 compared to control. bP < .05 compared with TNF-α–treated cells.
Figure 6
Figure 6
Effect of ethanol and metformin on phosphorylation status of c-Met, hepatic levels of ApoB (100 and 48), and hepatic MTTP activity after acute alcohol ingestion. Animals and treatments are as described in Materials and Methods. (A) Representative Western blots of phosphorylated and total c-Met. (B) Quantitative analysis of blots. (C) Representative Western blots of ApoB100 and B48. (D) Quantitative analysis of blots. Data for ApoB100 and B48 were normalized to β-actin. (E) Results of determination of hepatic MTTP activity. Data are mean values ± SEM (B, D, and E) and are normalized to percent of control (n = 4−6). aP < .05 compared with wild-type mice administered maltose dextrin. bP < .05 compared with wild-type mice administered ethanol.
Figure 7
Figure 7
Photomicrographs of livers following chronic ethanol treatment. Animals were fed high-fat control or high-fat ethanol-containing diets enterally for 4 weeks as described in Materials and Methods. Representative photomicrographs (100×) of livers from wild-type mice fed control diet (A), wild-type mice fed ethanol diet (B), wild-type mice fed ethanol diet containing metformin (C), and PAI-1 knockout mice fed ethanol diet (D) are shown. Additional panels (200×) show focal inflammatory (E) and necrotic (F) changes observed in wild-type mice fed chronic ethanol-containing diet.
Figure 8
Figure 8
Effect of ethanol and metformin on alanine aminotransferase activity and pathology scores. Animals were fed high-fat control or high-fat ethanol-containing diets enterally for 4 weeks as described in Materials and Methods. Alanine aminotransferase (ALT; A) activity and pathology scores (B) were determined as described in Materials and Methods. Data represent means ± SEM (n = 4−6). aP < .05 compared to mice fed high-fat control diet; bP < .05 compared to wild-type mice fed high-fat ethanol diet.

Comment in

  • Metformin and the fate of fat.
    Hoek JB. Hoek JB. Gastroenterology. 2006 Jun;130(7):2234-7. doi: 10.1053/j.gastro.2006.05.009. Gastroenterology. 2006. PMID: 16762646 No abstract available.

References

    1. Grant BF, Dufour MC, Harford TC. Epidemiology of alcoholic liver disease. Semin Liver Dis. 1988;8:12–25. - PubMed
    1. MacSween RN, Burt AD. Histologic spectrum of alcoholic liver disease. Semin Liver Dis. 1986;6:221–232. - PubMed
    1. Day CP, James OF. Hepatic steatosis: innocent bystander or guilty party? Hepatology. 1998;27:1463–1466. - PubMed
    1. Harrison SA, Diehl AM. Fat and the liver—a molecular overview. Semin Gastrointest Dis. 2002;13:3–16. - PubMed
    1. Arteel GE. Oxidants and antioxidants in alcohol-induced liver disease. Gastroenterology. 2003;124:778–790. - PubMed

Publication types

MeSH terms