Two different oxygen sensors regulate oxygen-sensitive K+ transport in crucian carp red blood cells
- PMID: 16763000
- PMCID: PMC1819415
- DOI: 10.1113/jphysiol.2006.112680
Two different oxygen sensors regulate oxygen-sensitive K+ transport in crucian carp red blood cells
Abstract
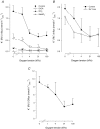
The O2 dependence of ouabain-independent K+ transport mechanisms has been studied by unidirectional Rb+ flux analysis in crucian carp red blood cells (RBCs). The following observations suggest that O2 activates K+-Cl- cotransport (KCC) and deactivates Na+-K+-2Cl- cotransport (NKCC) in these cells via separate O2 sensors that differ in their O2 affinity. When O2 tension (PO2) at physiological pH 7.9 was increased from 0 to 1, 4, 21 or 100 kPa, K+ (Rb+) influx was increasingly inhibited, and at 100 kPa amounted to about 30% of the value at 0 kPa. This influx was almost completely Cl- dependent at high and low PO2, as shown by substituting Cl- with nitrate or methanesulphonate. K+ (Rb+) efflux showed a similar PO2 dependence as K+ (Rb+) influx, but was about 4-5 times higher over the whole PO2 range. The combined net free energy of transmembrane ion gradients favoured net efflux of ions for both KCC and NKCC mechanisms. The KCC inhibitor dihydroindenyloxyalkanoic acid (DIOA, 0.1 mM) abolished Cl- -dependent K+ (Rb+) influx at a PO2 of 100 kPa, but was only partially effective at low PO2 (0-1 kPa). At PO2 values between 0 and 4 kPa, K+ (Rb+) influx was further unaffected by variations in pH between 8.4 and 6.9, whereas the flux at 21 and 100 kPa was strongly reduced by pH values below 8.4. At pH 8.4, where K+ (Rb+) influx was maximal at high and low PO2, titration of K+ (Rb+) influx with the NKCC inhibitor bumetanide (1, 10 and 100 microM) revealed a highly bumetanide-sensitive K+ (Rb+) flux pathway at low PO2, and a relative bumetanide-insensitive pathway at high PO2. The bumetanide-sensitive K+ (Rb+) influx pathway was activated by decreasing PO2, with a PO2 for half-maximal activation (P50) not significantly different from the P50 for haemoglobin O2 binding. The bumetanide-insensitive K+ (Rb+) influx pathway was activated by increasing PO2 with a P50 significantly higher than for haemoglobin O2 binding. These results are relevant for the pathologically altered O2 sensitivity of RBC ion transport in certain human haemoglobinopathies.
Figures


Similar articles
-
Apparent intermediate K conductance channel hyposmotic activation in human lens epithelial cells.Am J Physiol Cell Physiol. 2008 Mar;294(3):C820-32. doi: 10.1152/ajpcell.00375.2007. Epub 2008 Jan 9. Am J Physiol Cell Physiol. 2008. PMID: 18184876
-
Regulation of potassium transport in human lens epithelial cells.Exp Eye Res. 2006 Jan;82(1):55-64. doi: 10.1016/j.exer.2005.05.002. Epub 2005 Jul 5. Exp Eye Res. 2006. PMID: 16002066
-
Differential oxygen sensitivity of the K+-Cl- cotransporter in normal and sickle human red blood cells.J Physiol. 1998 Aug 15;511 ( Pt 1)(Pt 1):225-34. doi: 10.1111/j.1469-7793.1998.225bi.x. J Physiol. 1998. PMID: 9679176 Free PMC article.
-
Regulation of Na-K-2Cl cotransport in red cells.Adv Exp Med Biol. 2004;559:77-88. doi: 10.1007/0-387-23752-6_7. Adv Exp Med Biol. 2004. PMID: 18727229 Review. No abstract available.
-
Control of mitochondrial and cellular respiration by oxygen.J Bioenerg Biomembr. 1995 Dec;27(6):583-96. doi: 10.1007/BF02111656. J Bioenerg Biomembr. 1995. PMID: 8746845 Review.
Cited by
-
Regulation of K-Cl cotransport in erythrocytes of frog Rana temporaria by commonly used protein kinase and protein phosphatase inhibitors.J Comp Physiol B. 2010 Mar;180(3):385-91. doi: 10.1007/s00360-009-0418-5. J Comp Physiol B. 2010. PMID: 19936761
-
Characterization of the deoxyhemoglobin binding site on human erythrocyte band 3: implications for O2 regulation of erythrocyte properties.Blood. 2008 Jan 15;111(2):932-8. doi: 10.1182/blood-2007-07-100180. Epub 2007 Oct 17. Blood. 2008. PMID: 17942752 Free PMC article.
References
-
- Adragna NC, Di Fulvio M, Lauf PK. Regulation of K+–Cl− cotransport: from function to genes. J Membr Biol. 2004;201:109–137. - PubMed
-
- Berenbrink M, Bridges CR. Active Na+-, Cl−-, and HCO3−-dependent acid extrusion in Atlantic cod red blood cells in winter activated by hypercapnia. J Exp Biol. 1994;192:239–252. - PubMed
-
- Berenbrink M, Koldkjær P, Kepp O, Cossins AR. Evolution of oxygen secretion in fishes and the emergence of a complex physiological system. Science. 2005;307:1752–1757. - PubMed
-
- Berenbrink M, Weaver YR, Cossins AR. Defining the volume dependence of multiple K+ flux pathways in trout red blood cells. Am J Physiol. 1997;272:C1099–C1111. - PubMed
Publication types
MeSH terms
Substances
LinkOut - more resources
Full Text Sources
Medical
Research Materials

