. 2006 Jun 7;26(23):6213-29.
doi: 10.1523/JNEUROSCI.5594-05.2006.

Hippocampal slow oscillation: a novel EEG state and its coordination with ongoing neocortical activity

Affiliations

Hippocampal slow oscillation: a novel EEG state and its coordination with ongoing neocortical activity

Trish Wolansky et al. J Neurosci. .

Abstract

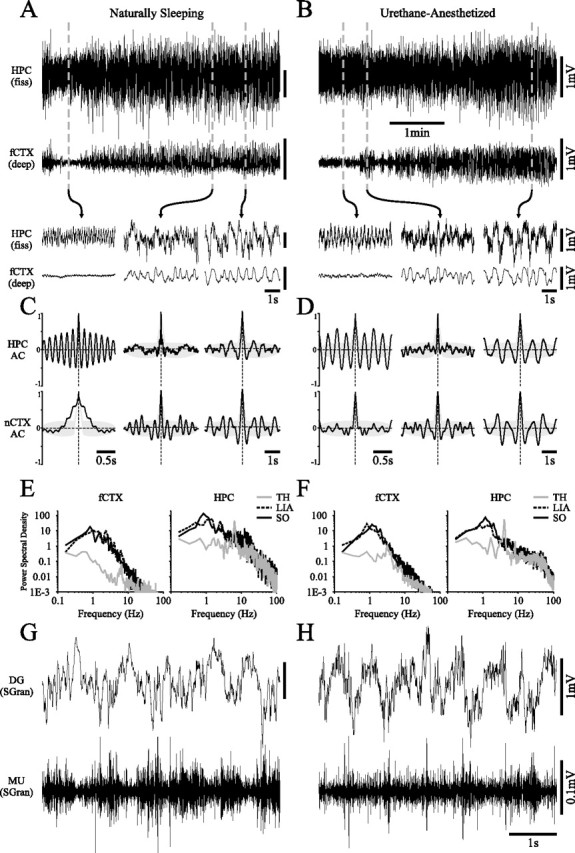
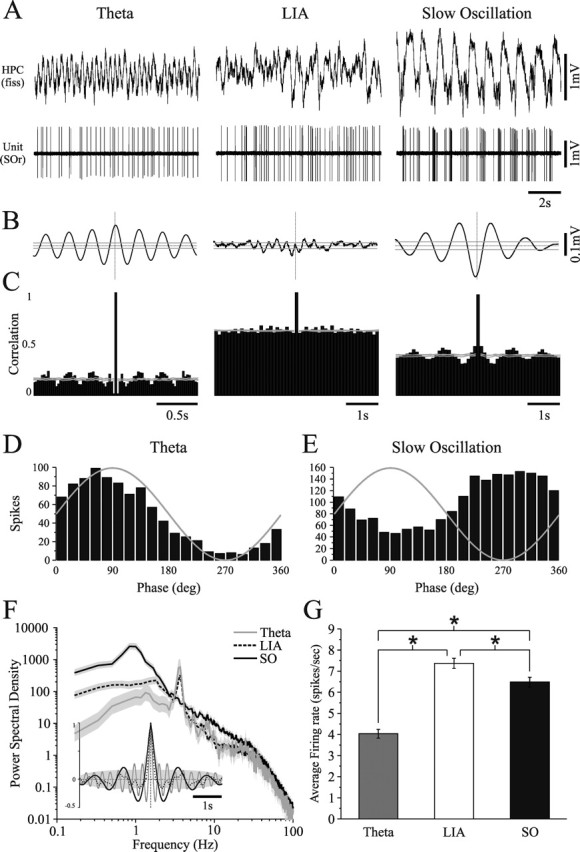
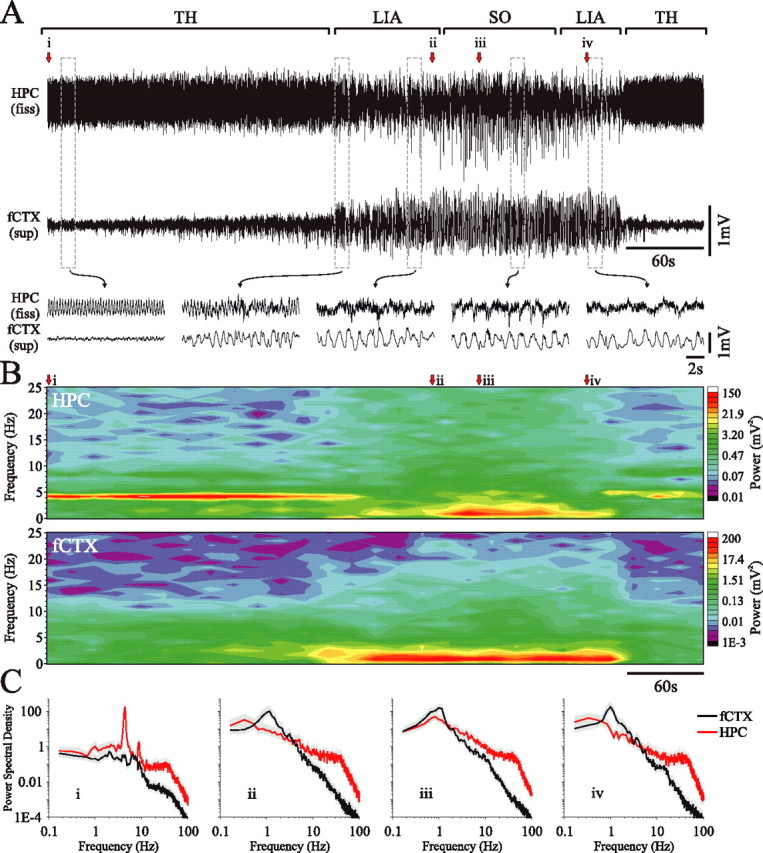
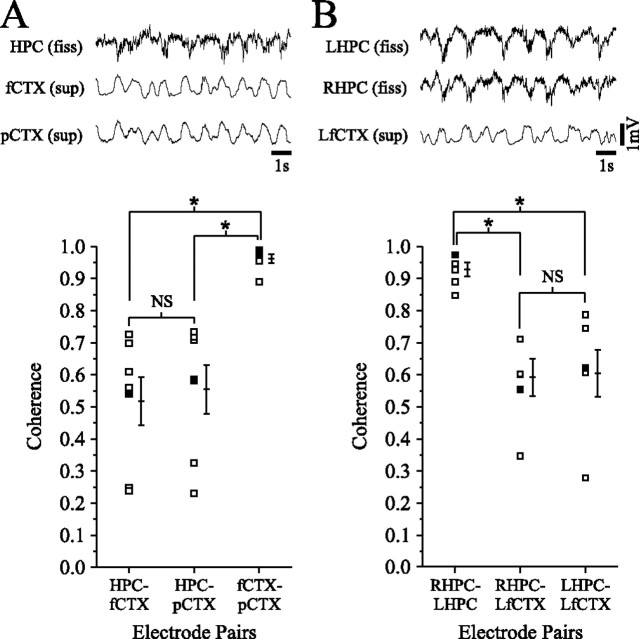
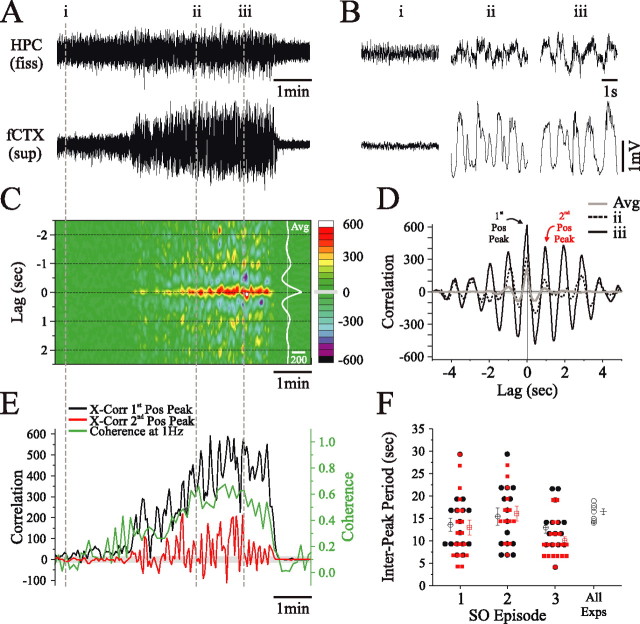
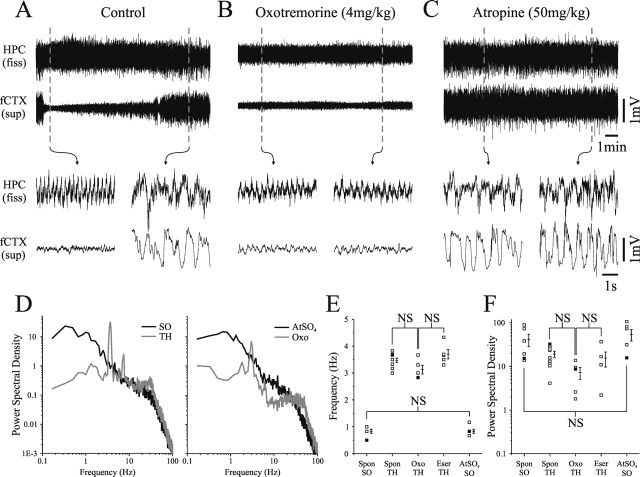
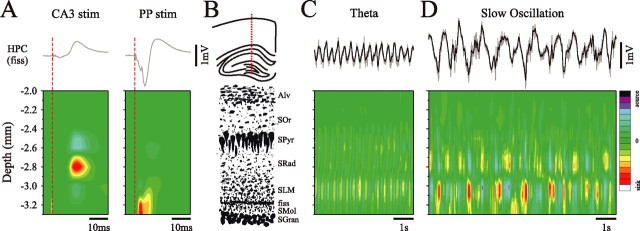
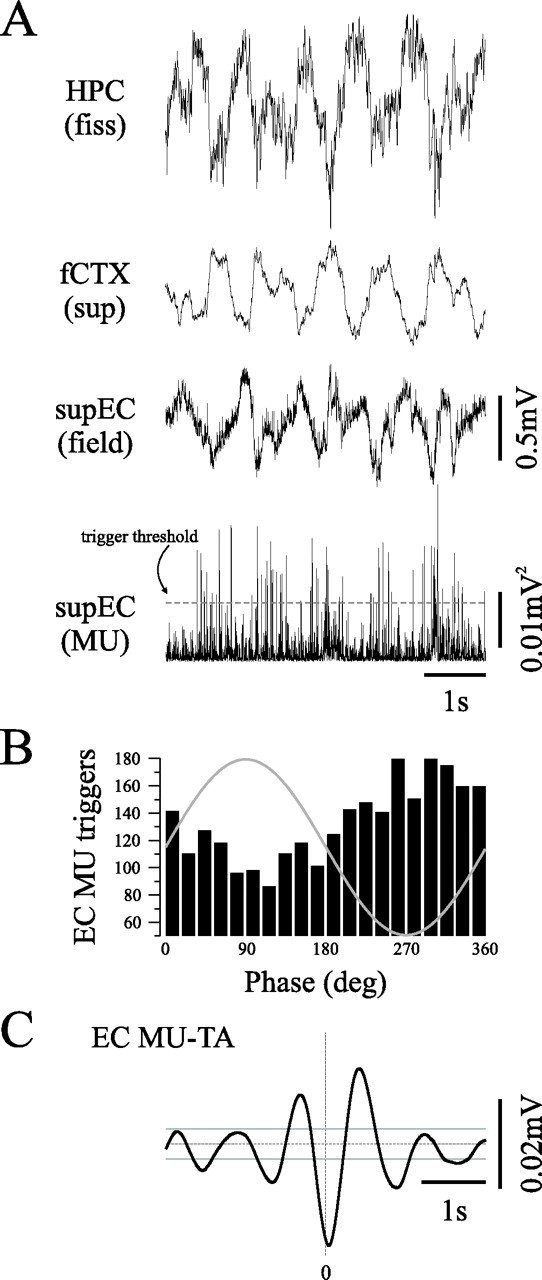
State-dependent EEG in the hippocampus (HPC) has traditionally been divided into two activity patterns: theta, a large-amplitude, regular oscillation with a bandwidth of 3-12 Hz, and large-amplitude irregular activity (LIA), a less regular signal with broadband characteristics. Both of these activity patterns have been linked to the memory functions subserved by the HPC. Here we describe, using extracellular field recording techniques in naturally sleeping and urethane-anesthetized rats, a novel state present during deactivated stages of sleep and anesthesia that is characterized by a prominent large-amplitude and slow frequency (< or =1 Hz) rhythm. We have called this activity the hippocampal slow oscillation (SO) because of its similarity and correspondence with the previously described neocortical SO. Almost all hippocampal units recorded exhibited differential spiking behavior during the SO as compared with other states. Although the hippocampal SO occurred in situations similar to the neocortical SO, it demonstrated some independence in its initiation, coordination, and coherence. The SO was abolished by sensory stimulation or cholinergic agonism and was enhanced by increasing anesthetic depth or muscarinic receptor antagonism. Laminar profile analyses of the SO showed a phase shift and prominent current sink-source alternations in stratum lacunosum-moleculare of CA1. This, along with correlated slow oscillatory field and multiunit activity in superficial entorhinal cortex suggests that the hippocampal SO may be coordinated with slow neocortical activity through input arriving via the temporo-ammonic pathway. This novel state may present a favorable milieu for synchronization-dependent synaptic plasticity within and between hippocampal and neocortical ensembles.


Figures

Figure 1.
Figure 1.
Slow oscillatory field activity in the hippocampus is a feature of the deactivated state of both natural sleep and urethane anesthesia. Long-duration recordings of hippocampal (top) and neocortical (bottom) field activity during natural sleep (A) and urethane anesthesia (B) in the same animal. Both demonstrate spontaneous shifts from activated to deactivated EEG states of which the fine temporal features are highlighted in the expansions below. Note that across this state shift, hippocampal field activity was gradually transformed from theta to a large-amplitude slow oscillation that was similar to slow activity in the nCTX. This transformation occurred through a state characterized by irregular hippocampal activity. Corresponding autocorrelation functions (significant values are those outside gray shaded area) and power spectra for each recording site across the three states are shown for natural sleep (C, E) and for anesthesia (D, F). A strong power peak and slow rhythmical activity was observed in the cortical signal during the entire deactivated state across the two conditions. This was only the case in the HPC at later stages of the deactivated state. Dentate gyrus (DG) stratum granulosum (SGran) field and multiunit (MU) activity recorded in another animal during the SO suggested phase locking of unit activity to the local field oscillations in both sleeping (G) and anesthetized (H) conditions. fiss, Fissure; AC, autocorrelation; TH, theta.
Figure 2.
Figure 2.
Three distinct states of hippocampal field and unit activity during urethane anesthesia. A, Hippocampal field (top) and stratum oriens (SOr) single-unit (bottom) activity at three separate instances during a single recording episode. Representative traces are plotted for theta, LIA, and the SO. Each state was characterized by distinct patterns of field waveforms, spike trains, and field-unit correlations. B, Spike-triggered averages of field activity and spike train autocorrelation histograms (C) for the three respective hippocampal states shown in A. Gray lines in B and C represent 95% confidence intervals. Phase histograms for this unit during theta (D) and the SO (E) demonstrate significant state-dependent phase-related preferences, which changed across states. Both phase histograms were significantly nonuniform. F, Power spectra and autocorrelation functions of hippocampal field activity demonstrate the differences in frequency components and rhythmicity across all three states (gray shaded area represents 95% confidence interval). The SO was characterized by a dramatic increase in rhythmic power and a shift of peak frequency values to a lower range (∼1 Hz and below). G, Average firing rates of the same cell for a 60 s episode in each state showing significant differences between all three states. fiss, Fissure.
Figure 3.
Figure 3.
Differential evolution of hippocampal and neocortical slow oscillatory states during urethane anesthesia. A, Simultaneous field recordings from the HPC and superficial frontal cortex during a spontaneous field state change. Bracketed segments (top) and expansions (bottom) of the traces highlight the features of the transitive evolution of the hippocampal SO compared with the neocortical SO. The beginning (and end) of the episode was characterized by activated patterns in both hippocampal (theta) and neocortical (LVFA) traces. The transition to slower and larger amplitude rhythms (culminating in the SO) appeared first in the nCTX, whereas the SO in the HPC appeared later, after an initial transition through LIA. This point is more clearly shown in the continuous spectrogram (B). C, Power spectra for fixed 60 s episodes beginning at points i, ii, iii, and iv as indicated in A and B (gray shaded area represents 95% confidence interval). TH, Theta; fiss, fissure.
Figure 4.
Figure 4.
Cortical-cortical, hippocampal-hippocampal, and cortical-hippocampal coherence of the slow oscillation during urethane anesthesia. Representative field recordings from the HPC and two distant cortical sites [fCTX and posterior occipital cortex (pCTX)] are shown in A, and recordings from the fCTX and two isotypic points in the right HPC (RHPC) and left HPC (LHPC) are shown in B. Although cortical EEG traces in A and hippocampal EEG traces in B look almost identical, there is more variation between cortical and hippocampal field activity. The bottom panel shows coherence measurements between the above sites for seven different experiments in A and six other experiments in B (filled squares represent measures for data shown in top panel). Averages and SEM are offset to the right of each pairwise plot. These demonstrate that although cortical-cortical and hippocampal-hippocampal coherence of the SO is relatively invariable and extremely high, cortical-hippocampal coherence tends to be more variable and significantly lower. NS, Not significant; LfCTX, left fCTX; fiss, fissure.
Figure 5.
Figure 5.
Dynamic coordination of the hippocampal and neocortical slow oscillations during urethane anesthesia. A, Simultaneous long-term field recordings and expansions from indicated positions (B) from the HPC and deep fCTX during a spontaneous field state change. As shown previously (Fig. 3), there is a lack of correlation between cortical and hippocampal SO early in the evolution of this activity. C, Time-aligned sliding cross-correlogram of hippocampal and cortical signals shown in A. As suggested by the raw traces in B, there is a gradual increase of the rhythmic correlation of slow oscillatory activity through the episode as denoted by the development of positive peaks at lag intervals of ∼1 s (hot colors) centered around ∼0 s (95% confidence interval represented by gray box on color scale; all colors other than green represent significant changes). The average cross-correlation function computed across the entire episode is shown in white at the right of the panel. D, Individual cross-correlation functions computed at time points ii and iii in A and B are superimposed with the averaged (Avg) cross-correlation function from C. As suggested by the traces, the cross-correlation of the signals increases substantially when comparing time point ii to time point iii. This increase waxes and wanes, as observed by periodic increases and decreases of the peak values in C (95% confidence interval represented by gray shaded area). E, Dynamics of the first (black; lag, −25 ms) and second (red; lag, 1000 ms) positive peak (Pos Peak) values of the cross-correlation (X-Corr) function and coherence values at 1 Hz (green) across the entire episode [time aligned to the raw data (A) and cross-correlogram (C)]. Although the values of the cross-correlation peak tend to increase across time (shown by a related increase in coherence), there is also a systematic and seemingly periodic fluctuation in these values every 10–20 s (95% confidence interval represented by gray shaded area). F, The period of these fluctuations was plotted and averaged for the first (black circles) and second (red squares) positive correlation peaks for multiple SO episodes in the same rat (1, 2, and 3; unfilled squares represent measures for data shown) and across all experiments (All Exps). The period within and across experiments showed a high degree of overlap across all animals. fiss, Fissure.
Figure 6.
Figure 6.
The slow oscillation is abolished by muscarinic agonism and enhanced by muscarinic antagonism during urethane anesthesia. A, Simultaneously recorded field signals from the HPC and nCTX showing a spontaneous state change. B, After intraperitoneal administration of 4 mg/kg oxotremorine, a continuously activated (theta and LVFA) state was elicited. C, Conversely, subsequent intraperitoneal administration of 50 mg/kg atropine sulfate (AtSO4) elicited a continuous deactivated (SO) state. D, Spectra of spontaneous and pharmacologically induced states appeared highly similar in terms of peak frequencies (E) as well as peak power values (F) and statistical comparison verified that there was no significant difference. fiss, Fissure; TH, theta; Oxo, oxotremorine; Spon, spontaneous; Eser, eserine.
Figure 7.
Figure 7.
Spectral profile of the slow oscillation and theta during urethane anesthesia. Sequential laminar profiles of field activity were recorded in 0.5 mm increments through the dorsal to ventral axis of the brain, to a final depth of 4.5 mm using a multichannel probe; each line represents one laminar recording spanning 1.4 mm with the multiprobe. A histological photomicrograph of the multiprobe track is shown in A. Spectral analysis was performed on these signals in addition to simultaneously recorded field activity from fixed sites in the HPC and nCTX. B, Average spectral values, including autopower, phase, and coherence are plotted as a function of depth and aligned to the histology in A. Phase and coherence were computed with respect to the fixed neocortical signal during the SO and the fixed hippocampal signal during theta. The SO (red lines) null zone occurred in the nCTX at a depth of 0.9 mm (approximately layer V). It also showed a significant phase shift (∼20°) aligned with a maximal value within the HPC. This depth coincided with the position of the theta (black lines) maximum [approximately at the level of the hippocampal fissure (fiss)]. Coherence for both the SO and theta remained high throughout the profile except at positions that corresponded to phase reversals. The coherence of the SO within the HPC, however, was more variable, especially at locations near the power maximum. Raw field samples of theta (C) and the SO (D) from the numbered probe contacts are shown. Fast components of the SO, in addition to theta, reverse phase at a depth of 2.6 mm (trace 5). E, An average voltage profile clearly demonstrates the SO phase shift within the HPC. The corresponding average CSD shows a large sink at ∼3.0 mm and smaller sinks at ∼2.7 mm. The CSD scale is −13.0 to 13.0 mV/mm2.
Figure 8.
Figure 8.
Current source density analysis of theta and slow oscillatory activity during urethane anesthesia. CSD profiles of averaged evoked potentials in response to contralateral CA3 and ipsilateral perforant path (PP) stimulation (A) and 10 Hz lowpass-filtered, unaveraged, spontaneous theta (C) and SO field activity (D). For all profiles, the simultaneously recorded field potentials from contralateral fixed hippocampal sites are displayed (unfiltered potentials are shown in gray and lowpass-filtered traces are shown in black). CSD profiles were computed from field potentials recorded through the dorsal to ventral axis of the brain using a multichannel probe. A, The CSD profile of unfiltered, averaged evoked potentials was used to estimate the anatomical location of recording sites and is aligned to a hand-drawn representation of the cellular layers throughout the multiprobe track (B). The most prominent sink after CA3 stimulation was observed in SRad, corresponding to excitatory input from commissural fibers of the contralateral CA3 and the most prominent sink after perforant path stimulation was observed in the molecular layer of the dentate gyrus. C, During theta, prominent rhythmic alternations of sinks and sources are observed at the level of SLM of hippocampal CA1 and paired with alternating sources and sinks at the levels of SRad. D, During the SO, prominent and consistent sink-source alternations are also observed at the level of SLM and are often matched with weaker current flow in SRad. CSD scales are −125.0 to 125.0 mV/mm2 for contralateral CA3 stimulation and −370.0 to 370.0 mV/mm2 for PP stimulation in A, and −18.0 to 18.0 mV/mm2 for spontaneous activity in C and D. Alv, Alveus; SOr, stratum oriens; fiss, hippocampal fissure; SGran, stratum granulosum; SMol, stratum moleculare.
Figure 9.
Figure 9.
The slow oscillation is a prominent feature of entorhinal activity during urethane anesthesia. A, Simultaneously recorded hippocampal (top), neocortical, and superficial entorhinal (supEC) field activity show that the SO is prominent in all three structures. Rectified sup EC multiunit activity (supEC MU; bottom) was rhythmic (A) and was modulated by the ongoing SO (95% confidence interval represented by gray lines) (C). Phase histogram (B) was constructed using rectified supEC MU trigger (threshold represented by gray line) against supEC field and demonstrates that EC units tend to discharge just before the negative phase of the hippocampal field oscillation rhythmically at ∼1 Hz (C). fiss, Fissure.
Figure 10.
Figure 10.
The SO modulates other synchronized ensemble patterns in the HPC during urethane anesthesia. A, E, I, Unfiltered slow oscillatory activity (top) and simultaneously recorded ripples (A), dentate spikes (E), and gamma (I) (bottom panels) recorded in SPyr, the inner molecular layer of the dentate gyrus (DG), and SLM, respectively. Traces are time aligned to (B, F, I) SO-filtered SLM CSD (top) and rectified ripples (B), dentate spikes (F), and gamma traces (J) (bottom panels). Phase histograms were constructed using rectified trace (trigger threshold represented by gray lines) against respective SLM CSD. Phase histograms and event-triggered CSD averages demonstrate that dentate spikes (G, H) and gamma rhythms (K, L) were phase modulated by the SLM SO CSD and that ripples (C, D) were not phase modulated by the SLM SO CSD. Dentate spikes tended to occur during or just after maximal SO sink at the level of SLM, and gamma was maximal during the maximal SO sink in SLM. Gray lines in D, H, and L represent values for 95% confidence intervals. TA, Triggered average; rectHPC, rectified (filtered) HPC voltage trace; rectDG, rectified (filtered) dentate trace.

References

    1. Amzica F, Steriade M (1997). The K-complex: its slow (<1-Hz) rhythmicity and relation to delta waves. Neurology 49:952–959. - PubMed
    1. Amzica F, Steriade M (1998). Cellular substrates and laminar profile of sleep K-complex. Neuroscience 82:671–686. - PubMed
    1. Barrionuevo G, Brown TH (1983). Associative long-term potentiation in hippocampal slices. Proc Natl Acad Sci USA 80:7347–7351. - PMC - PubMed
    1. Battaglia FP, Sutherland GR, McNaughton BL (2004). Hippocampal sharp wave bursts coincide with neocortical “up-state” transitions. Learn Mem 11:697–704. - PMC - PubMed
    1. Bertram EH, Zhang DX (1999). Thalamic excitation of hippocampal CA1 neurons: a comparison with the effects of CA3 stimulation. Neuroscience 92:15–26. - PubMed

Publication types