. 2006 Jun 7;26(23):6269-81.
doi: 10.1523/JNEUROSCI.4212-05.2006.

Neuronal pentraxins mediate synaptic refinement in the developing visual system

Affiliations

Neuronal pentraxins mediate synaptic refinement in the developing visual system

Lisa Bjartmar et al. J Neurosci. .

Abstract

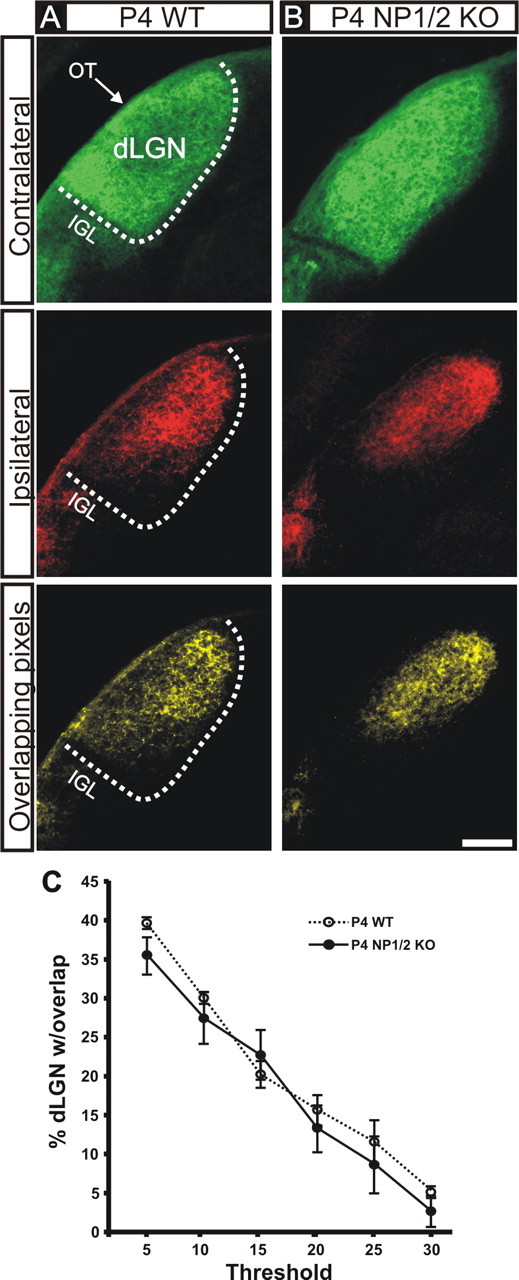
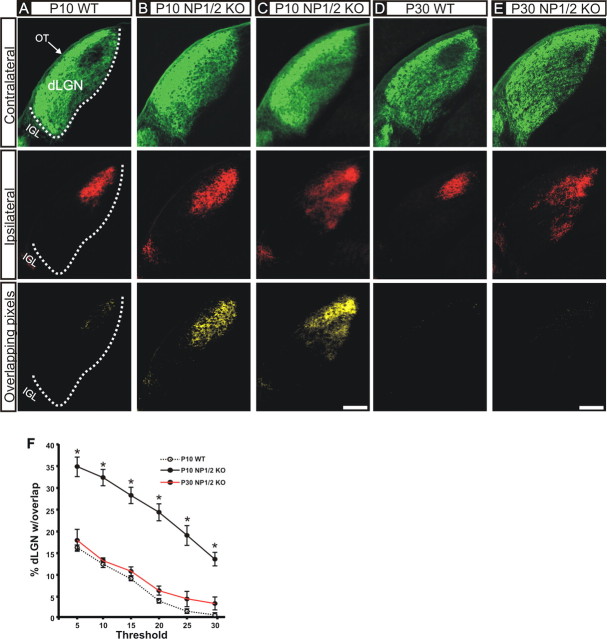
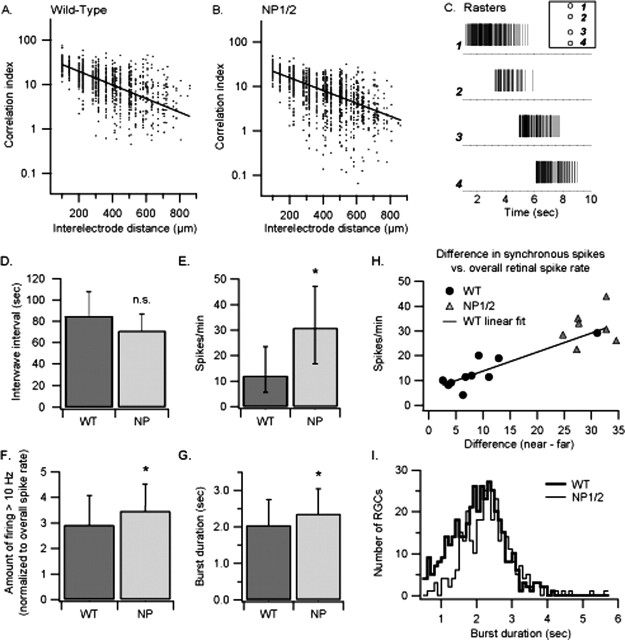
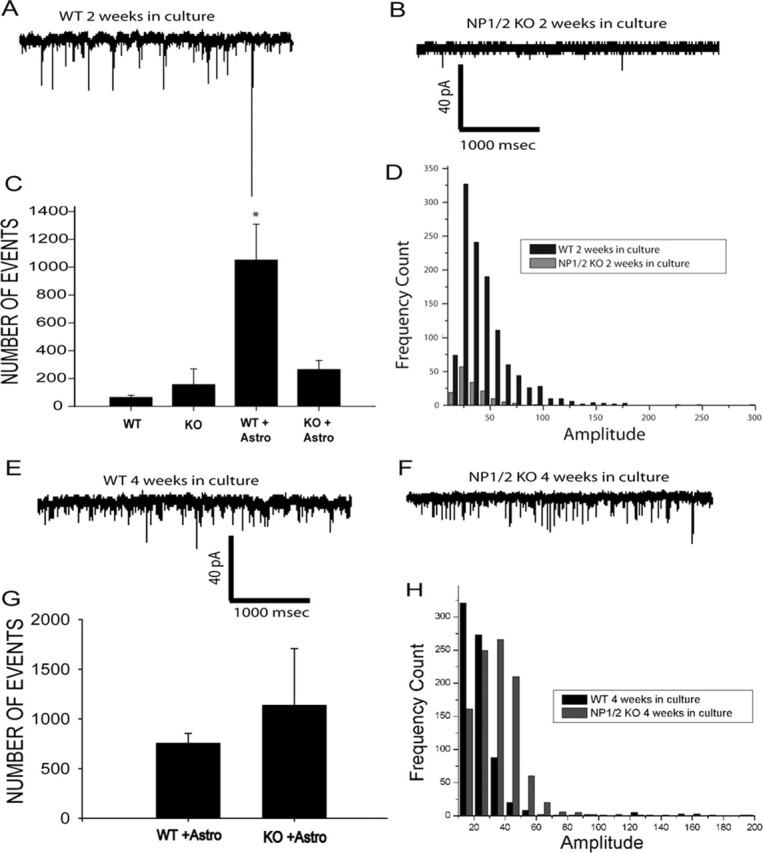
Neuronal pentraxins (NPs) define a family of proteins that are homologous to C-reactive and acute-phase proteins in the immune system and have been hypothesized to be involved in activity-dependent synaptic plasticity. To investigate the role of NPs in vivo, we generated mice that lack one, two, or all three NPs. NP1/2 knock-out mice exhibited defects in the segregation of eye-specific retinal ganglion cell (RGC) projections to the dorsal lateral geniculate nucleus, a process that involves activity-dependent synapse formation and elimination. Retinas from mice lacking NP1 and NP2 had cholinergically driven waves of activity that occurred at a frequency similar to that of wild-type mice, but several other parameters of retinal activity were altered. RGCs cultured from these mice exhibited a significant delay in functional maturation of glutamatergic synapses. Other developmental processes, such as pathfinding of RGCs at the optic chiasm and hippocampal long-term potentiation and long-term depression, appeared normal in NP-deficient mice. These data indicate that NPs are necessary for early synaptic refinements in the mammalian retina and dorsal lateral geniculate nucleus. We speculate that NPs exert their effects through mechanisms that parallel the known role of short pentraxins outside the CNS.


Figures

Figure 1.
Figure 1.
In situ hybridization for NP1, NP2, and NPR mRNAs in the retinal ganglion cell and inner nuclear layers of the retina. Transverse sections of rat eyes were hybridized with digoxigenin-labeled antisense cRNA probes to NP1 (A), NP2 (B), or NPR (C). D, Hematoxylin and eosin-stained section to reveal cell bodies and retinal layers. E, Sections were also incubated with NP1, NP2, and NPR sense probes. A representative section, with lack of specific signal, is shown here for the NP1 sense probe. F, Low-power image of NP1 mRNA localization, showing lack of a gradient for NP1 expression.
Figure 2.
Figure 2.
Immunofluorescence images of postnatal mouse retina stained with antibodies to NP1 (first column), NP2 (second column), or NPR (third column) at P5, P7, or P14. A–I, WT retinas. J–L, NP1/2/R KO retinas. In WT retinas (A–I), NP1-, NP2-, and NPR-immunopositive cells are seen in the ganglion cell layer at every age examined. No specific signal is seen in the retinas of NP1/2/R KO mice (J–L). IPL, Inner plexiform layer; GCL, ganglion cell layer. Scale bar, 50 μm.
Figure 3.
Figure 3.
Immunofluorescence images of postnatal mouse dLGN stained with antibodies to NP1 (first column), NP2 (second column), or NPR (third column) at P7 or P14. A–F, WT retinas. G–I, NP1/2 KO retinas. A, D, NP1 is expressed in dLGN neurons at P7 and P14 but with relatively lower levels at P14. B, E, NP2 is expressed on axons projecting to the dLGN (see Results). B, At P7, axonal expression is present throughout the dLGN except for in the innermost segment (asterisk), whereas at P14 (E), NP2 expression is enriched in the outer segment of the dLGN. C, F, Low levels of NPR are present at P7 and P14. G–I, No specific label is present for NP1, NP2, or NPR in dLGNs from NP1/2 KO mice, and NPR levels are reduced in NP1/2 KO mice relative to WT mice. Hipp, Hippocampus; IGL, intergeniculate leaflet; VPL, ventral posterolateral nucleus. Coronal plane is shown; dorsal is up and medial is to the right of each panel. The boundary of the dLGN is shown with the dashed line. Scale bar, 200 μm.
Figure 4.
Figure 4.
Generation of mice lacking NP2 or NPR and mice lacking multiple neuronal pentraxins. Mice lacking NP2 (A) and NPR (B) were generated through homologous recombination in ES cells with a targeting strategy. C, Alteration of genomic XhoI restriction fragment lengths in wild-type and recombined ES cells or BH1 in wild-type, heterozygous, and homozygous null NP2 mice. D, Alteration of genomic BglII restriction fragment lengths in wild-type, heterozygous, and homozygous null NPR mice. E, F, Alterations in NP2 and NPR message size and abundance in wild-type, heterozygous, and homozygous mice is shown in Northern blots. G, Chromatography of solubilized wild-type brains on taipoxin columns greatly enriches NP1, NP2, and NPR. H, Similar chromatography of solubilized brain from single, double, and triple KO mice shows the lack of the respective neuronal pentraxins. I, Loss of NPR in single, double, and triple KO mice shown by immunoprecipitation. J, Quantification of the loss of NP1, NP2, and NPR by taipoxin chromatography in select single, double, and triple KO mice. Ab, Antibody; FT, flow through; SM, solubilized membranes; BH1, BamH1; Wt, Wild-type.
Figure 5.
Figure 5.
Retinogeniculate projections from the two eyes in P4 WT and P4 NP1/2 KO mice. A, B, Photomicrographs of the contralateral eye projections (top panels), ipsilateral eye projections (middle panels), and the locations in which they overlap (bottom panels) in the dLGN of WT (A) and NP1/2 KO (B) P4 mice. In both the P4 WT and P4 KO mice, axons from the two eyes are extensively intermingled in the dLGN. Coronal plane is shown; dorsal is up and medial is to the right of each panel. IGL, Intergeniculate leaflet; OT, optic tract. The boundary of the dLGN is shown with the dashed line. Scale bar, 100 μm. C, Multi-threshold analysis of the percentage of the dLGN containing overlapping axons from both eyes in the dLGN (see Materials and Methods) of WT and NP1/2 KO mice revealed no significant differences in overlap at any threshold (n = 3 mice were analyzed per genotype at P4; Student's t test; ±SEM). All images are shown at same threshold level (15% above background; see Materials and Methods).
Figure 6.
Figure 6.
Retinogeniculate projections from the two eyes in P10 and P30 WT and NP1/2 KO mice. Except for scale, conventions are as in Figure 5. A, In P10 WT mice, inputs from the two eyes are segregated; a region in the dorsomedial dLGN is devoid of label from the contralateral eye. This region is occupied by the axons from the ipsilateral eye. Note also that axons from the ipsilateral eye are always restricted to the dorsomedial dLGN. B, C, In P10 NP1/2 KO mice, axons from the two eyes are still intermingled in the dLGN. The contralateral projection fills the entire dLGN; there is no gap present. B, In approximately half of the P10 NP1/2 mice examined, the ipsilateral eye projection comprises a single termination zone, but this zone appears larger than in WT mice. C, In the other cases, the ipsilateral eye axons are especially widespread. Despite these slight differences in patterning of the ipsilateral eye projection, in all P10 NP1/2 cases examined (n = 6 mice), the contralateral eye projection fills the entire dLGN, and thus axons from the two eyes always intermingled with those from the opposite eye, which is abnormal for mice of this age (compare bottom panels). D, Retinal inputs to the dLGN of P30 WT mice are segregated. E, Binocular inputs to the dLGN of P30 NP1/2 KO mice are also segregated (no yellow in bottom panel); however, note that compared with P10 or P30 WT mice, the ipsilateral axons are widespread and not restricted to the dorsomedial dLGN in NP1/2 KO mice (middle panels). Scale bars, 200 μm. F, Quantification of the percentage of the dLGN receiving overlapping inputs from the ipsilateral eye in WT versus NP1/2 KO mice at P10 and P30. P10 NP1/2 KO mice exhibit significantly more overlap in the dLGN than P10 WT mice, regardless of threshold. P30 KO mice have retino-dLGN inputs that are segregated to a degree similar to that of WT mice P10 and older (no significant differences observed at any threshold) (n = 4 P10 WT mice; n = 8 P10 NP1/2 KO mice; n = 2 P30 NP1/2 KO mice; Student's t test; ±SEM; ∗p < 0.0001). All images are shown at the same threshold level (15% above background; see Materials and Methods).
Figure 7.
Figure 7.
Early postnatal NP1/2 KO mouse retinas maintain activity characteristics important for eye-specific segregation. A, Correlation indices for electrically isolated RGC spikes in a single P4 WT retina versus distance between electrodes. The correlation index represents the likelihood that a cell recorded at one electrode fired a spike within a 100 ms time window of any spike from an RGC at another electrode. Each point represents the index for one such RGC pair plotted against the inter-electrode distance; the solid line is the best-fit single exponential for the population of distances. As expected, correlations are higher for cells that are nearer one another. B, Correlation indices calculated from the spikes of all RGC pairs recorded from a single P4 NP1/2 (neuronal pentraxin double knock-out) retina are shown. As in the WT retina, correlations are high for near-neighbor cells and decrease with increasing distance between them. C, Example spike rasters from a 9 s period of recording show the responses of individual RGCs as a wave travels across a P4 NP1/2 retina (the same one quantified in B). Inset illustrates the relative position of the electrodes (1–4) on the array. Electrodes 2, 3, and 4 were 200, 500, and 700 μm from electrode 1, respectively. This wave traveled at a speed of ∼130 μm/s across the recorded retinal area. D–G, Dark gray bars show WT values, and light gray bars show NP1/2 values. D, The interwave interval (and thus wave frequency) was not significantly different in NP1/2 retinas compared with WT retinas. E, The overall spike rate of cells recorded from NP1/2 retinas was significantly higher than in WT mice. F, When the amount of firing at ≥10 Hz for each recorded cell was normalized to the spike rate of that cell, NP1/2 RGCs had slightly more of this high-frequency firing compared with WT retinas. G, As waves of activity pass across the retina, individual ganglion cells fire bursts of spikes after periods of relative silence. The mean burst duration calculated from all recorded NP1/2 RGCs was significantly longer than the mean WT burst duration. H, Information on the near-neighbor relationships of RGCs can be carried by the level of correlated activity, with the spikes of near neighbors having high correlations and those of RGCs distant from one another having lower correlations. The overall spike rate and number of synchronous spikes for RGC pairs within a given time window (100 ms here) were higher for the NP1/2 retinas compared with the WT retinas. To determine for each RGC whether a near-neighbor RGC could still be distinguished from a spatially distant RGC based on the amount of correlated activity, we calculated the difference in the amount of correlated spiking between near-neighbor pairs and distant pairs. Pairs recorded on electrodes <150 μm apart were considered near neighbors, whereas those ≥600 μm apart were considered distant from one another. The difference in the median values for each retina was plotted against the overall median spike rate. Black circles represent WT retinas, and gray triangles represent NP1/2 retinas. The solid line is a linear fit to the WT data. The proximity of the NP1/2 data points to this line indicate that the difference in correlated activity in the NP1/2 retinas is very similar to that of the WT retinas. This suggests that the correlated activity in the NP1/2 retinas still contains retinotopic information. I, Histograms of median burst durations for RGCs of WT (thick line) and NP1/2 (thin line) are shown. The distributions show that the significant difference between burst durations shown in F result from (1) slightly longer bursts in many RGCs, (2) a few RGCs with much longer bursts in the NP1/2 retinas, and (3) a large group of RGCs with shorter burst durations in the WT retinas. Analyses of retinal wave parameters were based on 5 min periods of spike activity from P4 and P5 WT retinas (n = 10) and P4 NP1/2 retinas (n = 7) recorded on a multi-electrode array. D, F, G, Bars indicate SEM; in G they represent medians and quartiles, respectively. ∗p < 0.001. n.s., Not significant.
Figure 8.
Figure 8.
Retinal ganglion cells from NP1/2 KO animals show a delay in the formation of functional synapses in vitro. A, Patch-clamp recording of an RGC cultured with a feeding layer of astrocytes for 2 weeks. Numerous spontaneous mEPSCs are seen (downward deflections). B, Example of recordings of synaptic activity in NP1/2 KO RGC cultures after 2 weeks with astrocyte feeding layers. Fewer synaptic events are seen. Three sets of recordings from KO and WT cultures with between five and six neurons per condition were recorded for a total of 15 neurons per genotype. C, Quantification of the rate of spontaneous synaptic activity seen in RGC cultures from WT or KO mice. In both WT and KO, low rates of activity are seen in purified RGC cultures without astrocyte feeding layers. Astrocyte feeding layers significantly increase the frequency of synaptic activity in WT cultures (WT + Astro), but there is not a corresponding increase in KO cultures (KO + Astro) (WT + Astro, 1105 ± 347 events per minute vs KO + Astro, 293 ± 60 events per minute; p = 0.013; Kruskal–Wallis ANOVA on ranks). D, Frequency histogram of spontaneous synaptic events recorded in WT and KO RGC cultures after 2 weeks. The KO events (open bars) are much smaller amplitude compared with WT events (black bars; KO + Astro, 2 weeks in culture, 26 ± 0.2 pA vs WT + Astro, 2 weeks in culture, 44 ± 0.8 pA; Mann–Whitney rank sum test). The largest events likely represent multiquantal release (Paulsen and Heggelund, 1996). E, Example of synaptic activity measured in WT cultures with feeding layers of astrocytes after 4 weeks. High rates of spontaneous synaptic activity are still seen. F, Example of spontaneous synaptic activity seen in KO RGCs with feeding layers of astrocytes at 4 weeks in culture. High-frequency events are now seen in contrast to the cultures after 2 weeks. G, Quantification of the rate of synaptic activity seen in WT and KO RGC cultures with astrocyte feeding layers. No statistically significant differences in the rates of activity are seen between WT and KO cultures (WT + Astro, 1135 ± 570 events per minute vs KO + Astro, 756 ± 98 events per minute; p > 0.5; Kruskal–Wallis ANOVA on ranks). H, Frequency histograms of spontaneous synaptic activity measured in WT or KO cultures after 4 weeks. Astro, Astrocyte.
Figure 9.
Figure 9.
The number of synapses formed by RGCs cultured from NP1/2 KO mice is normal. A, B, RGC cultured without astrocytes and stained for synaptotagmin 1 (red) and PSD-95 (green) from WT (A) or NP1/2 KO (B) mice. C, D, RGC cultured with astrocytes and stained for synaptotagmin (red) and PSD-95 (green) from WT (C) or NP1/2 KO (D) mice. Scale bar, 20 μm. E, F, Number of synapses per field identified by colocalization of PSD-95 and synaptotagmin 1 at 2 weeks in culture (E) or 4 weeks in culture (F). Twenty cells were quantified per condition. These values are typical of RGCs in culture (Ullian et al., 2001; Christopherson et al., 2005). All values are mean ± SEM.

References

    1. Ball SL, Powers PA, Shin H-S, Morgans CW, Peachey NS, Gregg RG (2002). Role of the β2 subunit of voltage dependent calcium channels in the retinal outer plexiform layer. Invest Ophthalmol Vis Sci 43:1595–1603. - PubMed
    1. Banker G, Goslin K (1991). In: Culturing nerve cells Cambridge, MA: MIT.
    1. Barres BA, Silverstein BE, Corey DP, Chun LL (1988). Immunological, morphological and electrophysiological variation among retinal ganglion cells purified by panning. Neuron 1:791–803. - PubMed
    1. Boulanger LM, Huh GS, Shatz CJ (2001). Neuronal plasticity and cellular immunity: shared molecular mechanisms. Curr Opin Neurobiol 11:568–578. - PubMed
    1. Breviario F, d'Aniello EM, Golay J, Peri G, Bottazzi B, Bairoch A, Saccone S, Marzella R, Predazzi V, Rocchi M, Della Valle G, Dejana E, Mantovani A, Introna M (1992). Interleukin-1-inducible genes in endothelial cells: cloning of a new gene related to C-reactive protein and serum amyloid P component. J Biol Chem 267:22190–22197. - PubMed

Publication types

MeSH terms