. 2006 Oct 15;108(8):2655-61.
doi: 10.1182/blood-2006-03-011353. Epub 2006 Jun 8.

Expansion of FOXP3high regulatory T cells by human dendritic cells (DCs) in vitro and after injection of cytokine-matured DCs in myeloma patients

Affiliations

Expansion of FOXP3high regulatory T cells by human dendritic cells (DCs) in vitro and after injection of cytokine-matured DCs in myeloma patients

Devi K Banerjee et al. Blood. .

Abstract

CD4(+)CD25(+)FOXP3(+) regulatory T cells (Treg's) play an important role in the maintenance of immune tolerance. The mechanisms controlling the induction and maintenance of Treg's in humans need to be defined. We find that human myeloid dendritic cells (DCs) are superior to other antigen presenting cells for the maintenance of FOXP3(+) Treg's in culture. Coculture of DCs with autologous T cells leads to an increase in both the number of Treg's, as well as the expression of FOXP3 protein per cell both in healthy donors and myeloma patients. DC-mediated expansion of FOXP3(high) Treg's is enhanced by endogenous but not exogenous interleukin-2 (IL-2), and DC-T-cell contact, including the CD80/CD86 membrane costimulatory molecules. DCs also stimulate the formation of Treg's from CD25(-) T cells. The efficacy of induction of Treg's by DCs depends on the nature of the DC maturation stimulus, with inflammatory cytokine-treated DCs (Cyt-DCs) being the most effective Treg inducers. DC-induced Treg's from both healthy donors and patients with myeloma are functional and effectively suppress T-cell responses. A single injection of cytokine-matured DCs led to rapid enhancement of FOXP3(+) Treg's in vivo in 3 of 3 myeloma patients. These data reveal a role for DCs in increasing the number of functional FOXP3(high) Treg's in humans.


Figures

Figure 1.
Figure 1.
Comparison of different cell populations for the induction of CD4+CD25+ FOXP3+ Treg's. (A) Purified CD3+ T cells were cultured alone or with the indicated populations: myeloid DCs (Myel DCs), plasmacytoid DCs (PDCs), monocytes (Monos) and B cells. After 7 days of culture, the frequency of CD4+ FOXP3+ Treg's was assessed by FACS and compared with the frequency of the CD4+ FOXP3+ Treg's at day 0. Data show a summary of 2 experiments. *P < .05 for comparisons with myeloid DCs. (B) The graph depicts fold changes in numbers of CD4+ FOXP3+ Treg's at day 0 compared with numbers after culture either alone or with myeloid DCs (Myel DCs), plasmacytoid DCs (PDCs), monocytes (Monos), or B cells. *P < .05 for comparisons with myeloid DCs. (C) The amount of FOXP3 protein per CD4+ FOXP3+ cell was examined by determining the geometric mean fluorescence of the FOXP3 expression by FACS at day 7. *P < .05 for comparisons with myeloid DCs. Data shown represent means ± SD.
Figure 2.
Figure 2.
Expansion of CD4+CD25+ FOXP3+ Treg cells by monocyte-derived cytokine-matured DCs. (A) CD3 purified T cells were cultured alone or with monocyte-derived Cyt-DCs in the absence or presence of graded doses of IL-2 (0-200 U/mL). After 7 days, the numbers of CD4+ FOXP3+ Treg's were monitored by flow cytometry. Data (mean ± SD) show a summary of 5 experiments. P < .05 for comparisons with Cyt-DCs. (B) T cells were cultured either alone or with Cyt-DCs, and CD4+ FOXP3+ T cells were enumerated by FACS on days 0, 1, 2, 4, and 7. Data (mean ± SD) show a summary of 2 experiments. (C) T cells were labeled with CFSE and cultured alone or with Cyt-DCs, and proliferation monitored by flow cytometry on day 5. The figure represents 1 of 4 similar experiments.
Figure 3.
Figure 3.
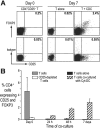
Induction of FOXP3+ T cells in CD4+CD25- T cells by DCs. (A) CD25- T cells were isolated by flow sorting and cultured alone (T alone) or with Cyt-DCs. After 7 days of culture, CD4+CD25+ FOXP3+ T cells were monitored by flow cytometry. One of 4 similar experiments. (B) CD25- T cells were cultured alone or with Cyt-DCs, and expression of FOXP3 protein was monitored by flow cytometry on days 0, 1, 4, and 7 of culture. The graph shows a summary of 2 experiments (mean ± SD).
Figure 4.
Figure 4.
Generation of FOXP3+ cells by cytokine matured DCs is contact, CD80/CD86, and IL-2 dependent. (A) T cells were cultured with Cyt-DCs in the presence or absence of transwell inserts. Data (mean ± SD) shown in the left panel are CD4+FOXP3+ cells expressed as a percentage of control cultures with no transwells. *P < .05. The representative FACS plots on the right are from 1 of the 3 experiments summarized in the panel on the left. (B) T cells were cultured with Cyt-DCs treated with anti-CD80 and anti-CD86 antibodies (1-5 μg/mL each), anti-IL-2 antibody (1-5 μg/mL), or isotype control. Data (mean ± SD) shown in the panel on the left are CD4+FOXP3+ cells expressed as a percentage of control cultures with isotype mAb-treated DCs.*P < .05. The representative FACS plots on the right are from 1 of the 3 experiments summarized in the panel on the left. The numbers in the FACS plots represent percentage of cells in that quadrant.
Figure 5.
Figure 5.
Effect of DC maturation stimulus on expansion of Treg's. (A) Maturation status of immature DCs (IDC) or DCs matured with inflammatory cytokines (Cyt-DC), FcγRIIB blockade (RIIB), CD40 ligand (CD40L), poly I:C, or LPS was monitored by examining the surface expression of CD83, CD80, CD86, and HLA-DR. The figure represents 1 of 3 similar experiments. (B) T cells were cultured either alone (T alone), or with immature DCs (IDC), or DCs matured with inflammatory cytokines (Cyt-DC), FcγRIIB blockade (RIIB), CD40 ligand matured DCs (CD40L), or the Toll-like receptor ligands poly I:C, or LPS. After 7 days of culture, the presence of FOXP3+ T cells was monitored by flow cytometry. The figure represents 1 of 5 similar experiments. The numbers represent the percentage of FOXP3high cells in the gated area. (C) As in panel B, different types of mature DCs were tested for the ability to induce Treg's in the CD4+ CD25- population. The plots represent 1 of 3 similar experiments.
Figure 6.
Figure 6.
Suppressive function of DC-induced Treg's. (A) T cells were cultured with DCs for 7 days, and the cocultures were labeled with CD25 PE and CD11c FITC. Cell sorting was used to obtain CD25high and CD25- fractions of CD11c- cells. The plot shows the postsort purity of the fractions used as suppressors in the MLR. (B) Suppression of the allogeneic MLR by Treg's induced by mature DCs. Mature DCs (from the same donor as used to generate the CD25+ FOXP3+ T cells) were cultured with CFSE labeled allogeneic responder T cells at a ratio of 1:10. CD25+ suppressors (middle panel) and CD25- cells (bottom panel) obtained via cell sorting were added to the cultures at suppressor-responder ratios of 1:3 to 1:30. Three to 4 days later, flow cytometry was performed to determine the proliferation in the cultures. Top panel shows control MLR without any cells added. (C) FOXP3+ Treg's were generated by culturing T cells with either Cyt-DCs or FcγRIIB blockade-matured DCs (RIIB-DC). Seven days later, DC-expanded T cells were subjected to cell-sorting as in panel A, and CD25+ and CD25- populations were obtained and used as suppressors. The MLR was set up with mature DCs (stimulators) and CFSE-labeled allogeneic T cells as responders as in panel B. The sorted CD25+ and CD25- T cells were added to compare the suppressive ability of the Treg's generated by DCs matured by 2 different maturation stimuli. (D) Bulk CD3+ T cells and sorted CD3+ CD25- T cells were cocultured with Cyt-DCs. After 7 days of coculture, T cells from both conditions were flow sorted to obtain CD25high as well as CD25- T cells as described in panel A. The CD25+ and CD25- cells were used as suppressors in an MLR. The MLR was set up with mature DCs and CFSE-labeled allogeneic T cells as responders as in panel B, and the CD25+ and CD25- populations were added to compare the suppressive ability of the Treg's generated from either bulk T cells or CD25- T cells (de novo Treg's).
Figure 7.
Figure 7.
Expansion of FOXP3+ Treg's by DCs from patients with myeloma. (A) CD14- cells were used as the source of T cells and either cultured alone or with autologous cytokine-matured DCs. Seven days later, FOXP3+ CD4+ T-cell numbers were examined by flow cytometry and compared with those seen in fresh blood at the time of blood draw. Numbers represent percentage of cells in that quadrant. (B) Results show mean (±SD) FOXP3+ CD4+ T-cell expansions from 3 different patients. Left panel shows expansion of CD4+ FOXP3+ T cells at the time of blood draw (day 0), and after 7 days of culturing T cells alone (T alone) and with cytokine matured DCs (T + Cyt-DCs). The right panel shows the geometric mean fluorescence of the FOXP3 expression in CD4+ FOXP3+ T cells before and after culture. (C) CD25+ and CD25- T cells were sorted after 7 days of culture with cytokine-matured DCs as described in Figure 5. An MLR was set up using patient DCs as stimulators and CFSE-labeled allogeneic T cells as responder cells at a 1:10 ratio. Patient CD25+ and CD25- cells were added as suppressors at a ratio of 1:3 to 1:30. Four days later, flow cytometry was performed to determine the proliferation of the CFSE-labeled responder cells. Figure represents 1 of 2 similar experiments. (D) Cytokine-matured DCs expand FOXP3+ CD4+ T cells in vivo. Flow cytometry was performed to examine FOXP3 expression in T cells before and after injection of cytokine-matured DCs in 4 patients. (E) The kinetics of FOXP3 expansion was examined in 3 patients who showed an increase in FOXP3+ CD4+ T cells. T cells were obtained before injection, 1 to 7 days after, and 28 days after injection of cytokine-matured DCs.

Similar articles

Cited by

References

    1. Sakaguchi S. Naturally arising Foxp3-expressing CD25+CD4+ regulatory T cells in immunological tolerance to self and non-self. Nat Immunol. 2005;6: 345-352. - PubMed
    1. Roncarolo MG, Levings MK. The role of different subsets of T regulatory cells in controlling autoimmunity. Curr Opin Immunol. 2000;12: 676-683. - PubMed
    1. von Boehmer H. Mechanisms of suppression by suppressor T cells. Nat Immunol. 2005;6: 338-344. - PubMed
    1. Kronenberg M. Toward an understanding of NKT cell biology: progress and paradoxes. Annu Rev Immunol. 2005;23: 877-900. - PubMed
    1. Hori S, Nomura T, Sakaguchi S. Control of regulatory T cell development by the transcription factor Foxp3. Science. 2003;299: 1057-1061. - PubMed

Publication types

MeSH terms