. 2006 Jun 21;25(12):2814-27.
doi: 10.1038/sj.emboj.7601168. Epub 2006 Jun 8.

Misorientation and reduced stretching of aligned sister kinetochores promote chromosome missegregation in EB1- or APC-depleted cells

Affiliations

Misorientation and reduced stretching of aligned sister kinetochores promote chromosome missegregation in EB1- or APC-depleted cells

V M Draviam et al. EMBO J. .

Abstract

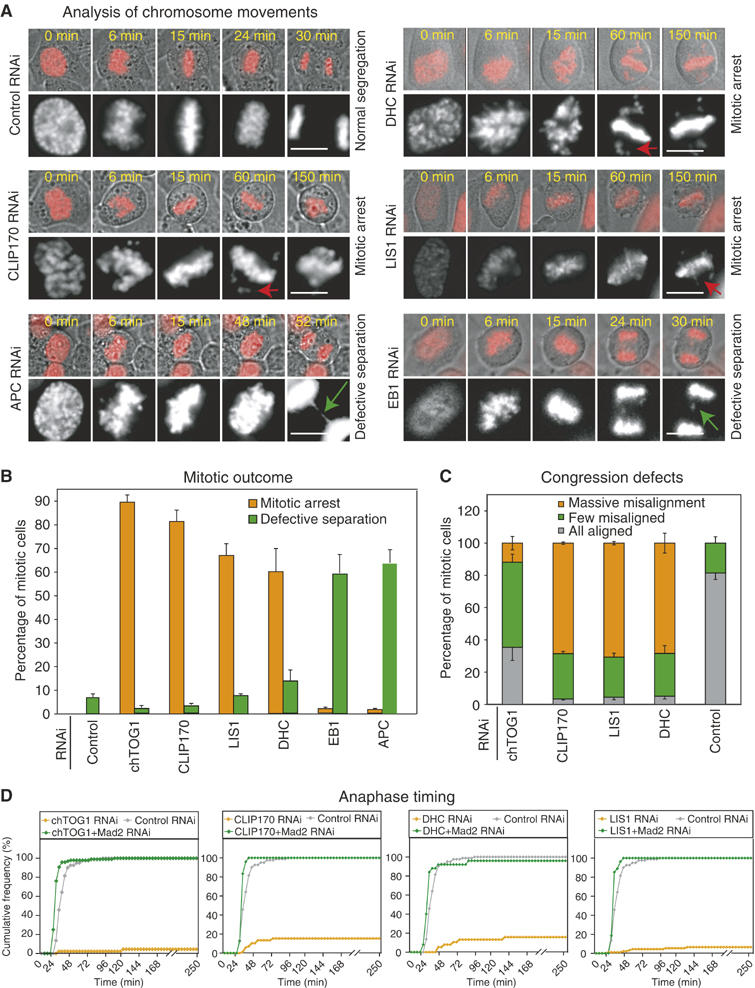
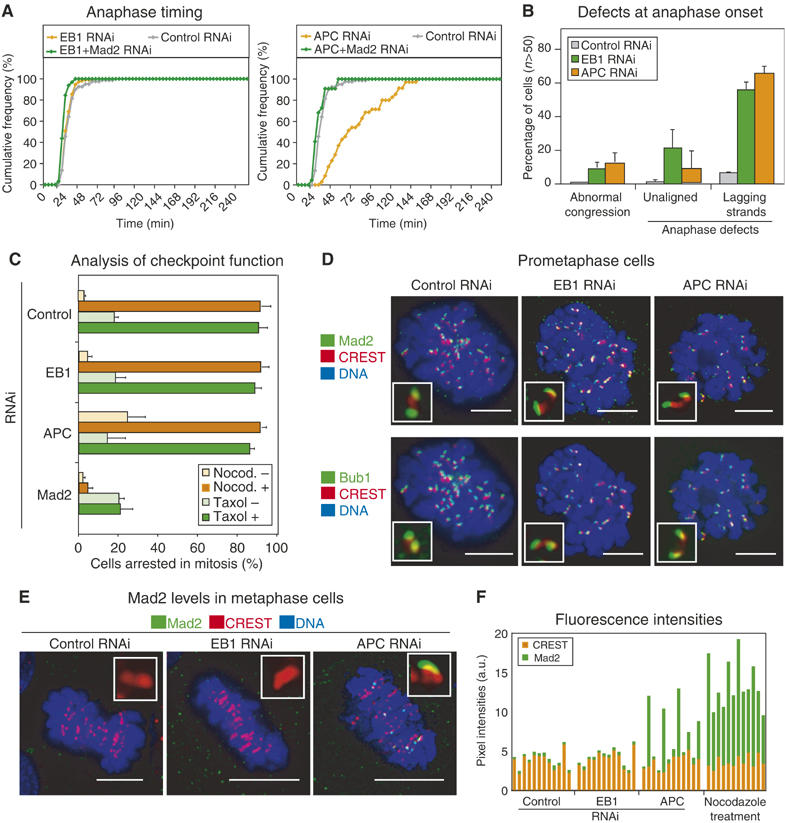
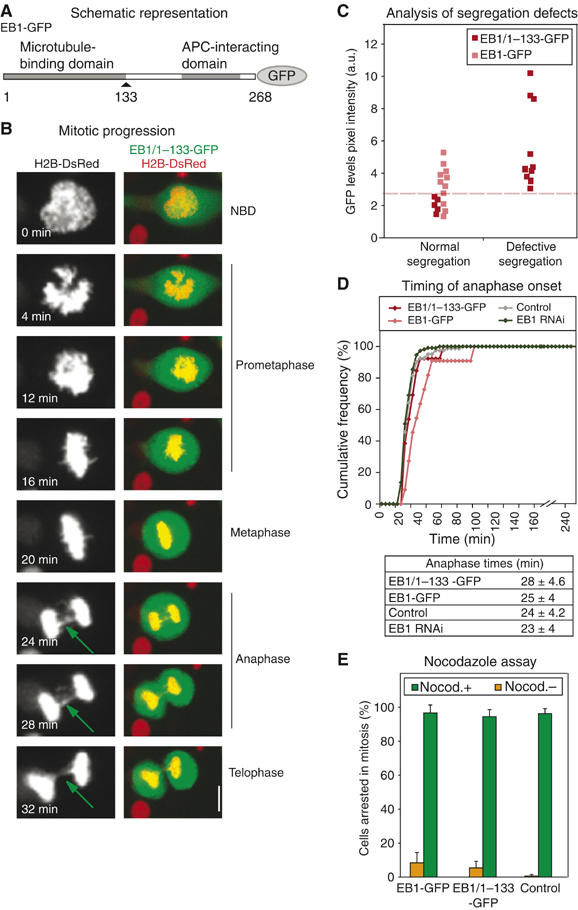
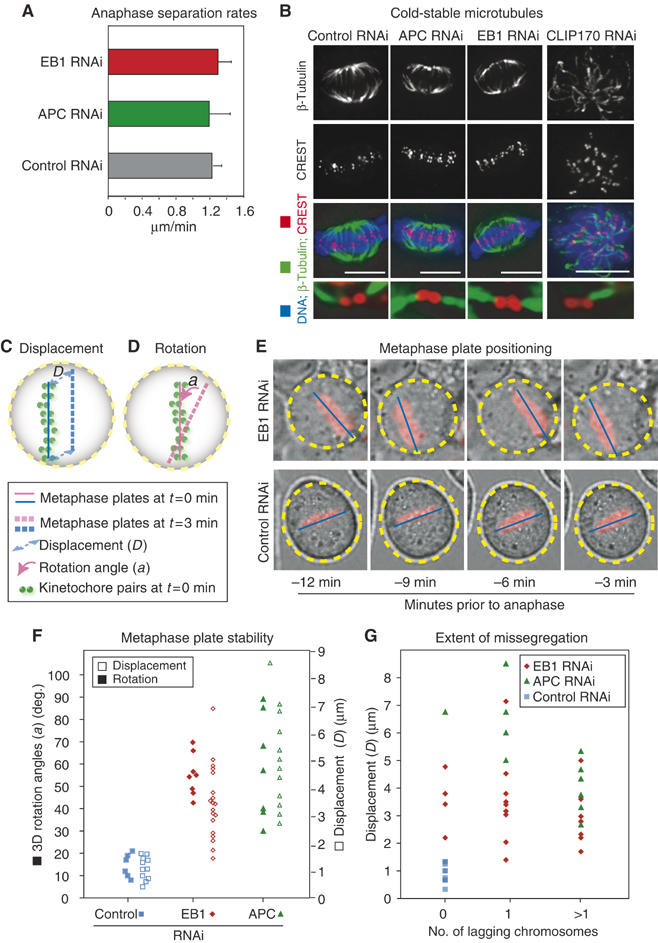
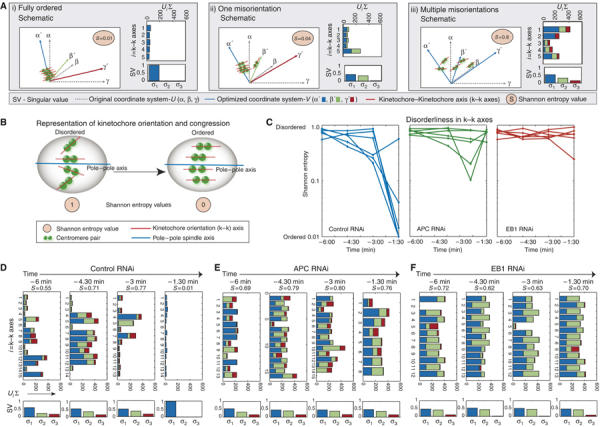
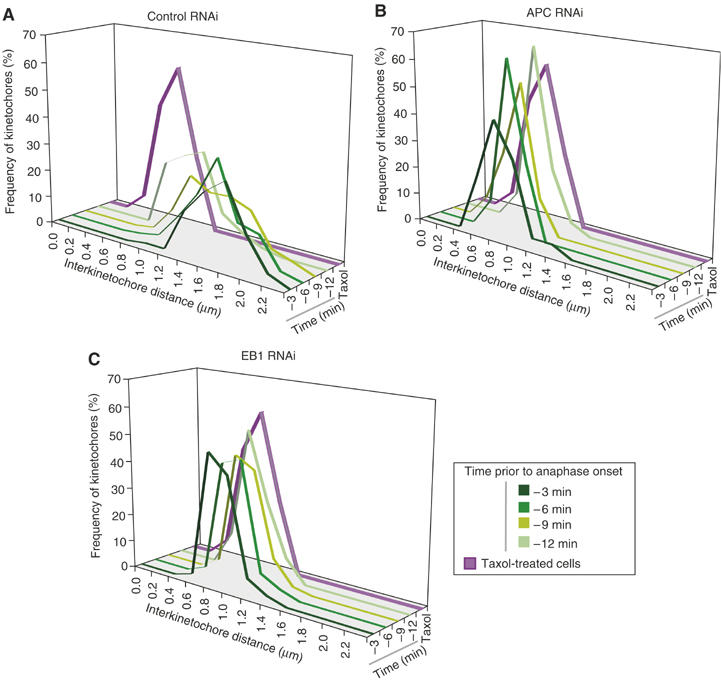
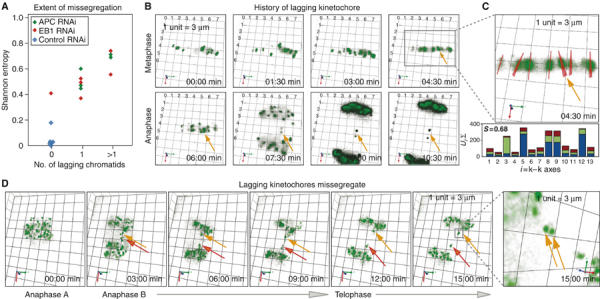
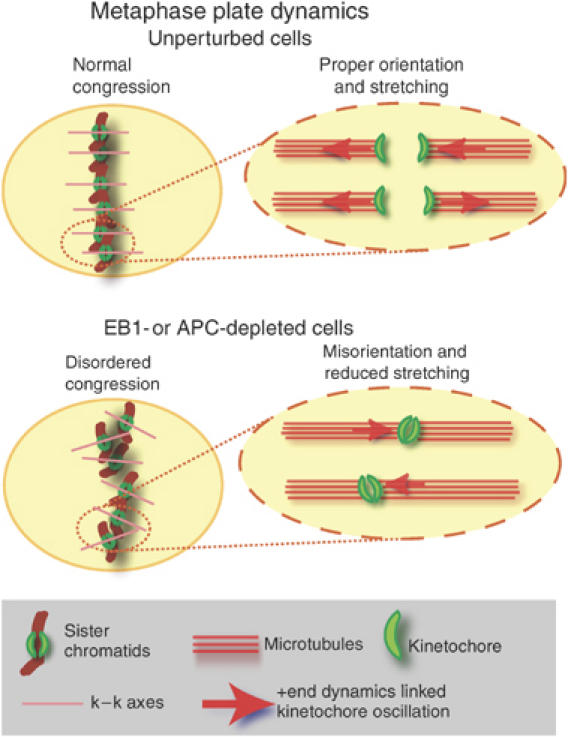
The correct formation of stable but dynamic links between chromosomes and spindle microtubules (MTs) is essential for accurate chromosome segregation. However, the molecular mechanisms by which kinetochores bind MTs and checkpoints monitor this binding remain poorly understood. In this paper, we analyze the functions of six kinetochore-bound MT-associated proteins (kMAPs) using RNAi, live-cell microscopy and quantitative image analysis. We find that RNAi-mediated depletion of two kMAPs, the adenomatous polyposis coli protein (APC) and its binding partner, EB1, are unusual in affecting the movement and orientation of paired sister chromatids at the metaphase plate without perturbing kinetochore-MT attachment per se. Quantitative analysis shows that misorientation phenotypes in metaphase are uniform across chromatid pairs even though chromosomal loss (CIN) during anaphase is sporadic. However, errors in kinetochore function generated by APC or EB1 depletion are detected poorly if at all by the spindle checkpoint, even though they cause chromosome missegregation. We propose that impaired EB1 or APC function generates lesions invisible to the spindle checkpoint and thereby promotes low levels of CIN expected to fuel aneuploidy and possibly tumorigenesis.


Figures

Figure 1
Figure 1
Analysis of mitotic outcome in kMAP-depleted cells. (A) Overlay of phase-contrast and fluorescent images of H2B-DsRed-expressing HeLa cells treated with siRNA as indicated. Gray-scale panels are two times magnified fluorescent images of top panels. NBD is set as t=0. Red and green arrows mark uncongressed and lagging chromosomes, respectively. Bar: 10 μm. (B) Mitotic outcome in control- or kMAP-depleted cells. Cells were scored as arrested prior to anaphase (orange) or having undergone defective anaphase in the presence of lagging or unaligned chromosomes (green). Error bars show s.d. based on at least three experiments. (C) Congression defects in control- or kMAP-depleted cells. Misalignment was visually scored as >5 (massive), 1–5 (few) or no chromosome away from the metaphase plate. (D) Cumulative frequency plots of anaphase onset times in siRNA-treated cells as indicated.
Figure 2
Figure 2
Depletion of EB1 or APC does not abrogate spindle checkpoint response. (A) Cumulative frequency plots of anaphase times in siRNA-treated cells as indicated. (B) Segregation defects in control-, EB1- or APC-depleted cells. Abnormal congression denotes the presence of unaligned chromosomes 3 min prior to anaphase onset. Cells with anaphase defects were scored as having unaligned chromosomes during anaphase separation or containing lagging chromosomes. Error bars show s.d. based on at least three different experiments. (C) Percentage of control-, EB1-, APC- or Mad2-depleted cells arrested in mitosis. In the presence or absence of nocodazole, cells in mitosis for >50 min after NBD were scored as arrested. In the presence or absence of taxol, mitotic arrest was scored by counting DAPI-stained condensed DNA. (D–E) Images of prometaphase (D) or metaphase (E) cells treated with siRNA as indicated, and stained with CREST sera to visualize kinetochores (red), and with Mad2 or Bub1 (green) antibodies. (F) Fluorescence intensities of Mad2 and CREST signals on kinetochores of siRNA- or nocodazole-treated cells as indicated. Inset: 0.25 × 0.25 μm. Bar: 10 μm.
Figure 3
Figure 3
EB1 mutants that cannot bind APC promote missegregation. (A) Representation of protein domains in EB1. (B) Representative still images of a mitotic cell expressing H2B-DsRed (red) and EB1/1–133-GFP (green). Right panels are overlay and left are gray-scale images intensified and two times magnified. Green arrows mark lagging chromatid strands. (C) Plot indicating correlation between expression levels of EB1/1–133-GFP or EB1-GFP (arbitrary intensity units) and missegregation scored as lagging chromosome in anaphase. Dashed line separates high and low expression levels. (D) Cumulative frequency plots of anaphase times in cells transfected with siRNA or vectors encoding EB1-GFP or EB1/1–133-GFP as indicated. Table indicates average anaphase times in at least 30 cells. (E) Percentage of mitotic cells with or without EB1-GFP or EB1/1-133-GFP expression that remained in mitosis for >50 min after NBD, in the presence or absence of nocodazole. Bar: 10 μm.
Figure 4
Figure 4
Analysis of lesions in EB1- or APC-depleted cells. (A) Average anaphase separation rates in siRNA-treated cells calculated using centroids of anaphase centromeres (see Supplementary Figure 5). (B) Images of EB1-, APC-, CLIP170-, or control-siRNA-treated cells costained with β-tubulin antibodies for MTs (green), CREST antisera for kinetochores (red) and DAPI for DNA (blue). Bottom panels are 3D rendered and eight times magnified. (C, D) Schematic of metaphase plate positions. Solid and broken lines (pink and blue) indicate the difference between the position of metaphase plate at t=0 and 3 min. (E) Overlay of phase-contrast and fluorescent images of metaphase cells treated with EB1- or control-siRNA. Blue lines and yellow circles highlight metaphase plate position with respect to the circumference of the cell. (F) Average rotation angles and displacement of metaphase plate every 3 min over a 12-min period prior to anaphase onset in individual cells treated with siRNA as indicated. (G) Plot correlating average displacement of metaphase plate and extent of missegregation. Missegregation was scored based on the presence of no lagging strands, or one, or few lagging strands.
Figure 5
Figure 5
EB1 or APC depletions perturb orientation of centromeric pairs. (A) Schematic representation of three distinct states of k−k axes orderliness. Orthogonal lines indicate orientations of the original coordinate system α, β, γ (gray) and new optimized directions α′, β′, γ′ (blue, green, red). Bar graphs show the contribution of each of the five k−k axes to the optimized directions. Plots below indicate singular values (SV) in three directions (σ1, σ2, σ3). (B) Schematic representation of disorderliness in k−k axes of congressed kinetochores. Shannon entropy values for a state of complete disorderliness=1 and orderliness=0. (C) Shannon entropy of 10–15 k−k axes calculated in each of five cells for a 6-min period prior to anaphase onset. Cells were transfected with control, EB1 or APC siRNA oligos as indicated. (D–F) Graphs indicate the contribution of individual k−k axes to optimized direction in cells treated with siRNA against control (D), APC (E) or EB1 (F) calculated from 3D images taken every 90 s for a 6-min period prior to anaphase. Upper panel indicate UiΣ for individual k−k axes. Lower panels indicate SV (σ1, σ2, σ3). S indicates Shannon entropy value.
Figure 6
Figure 6
EB1 or APC depletions reduce centromeric stretching. (A–C) Frequency distribution of interkinetochore distances in CENPB-GFP-expressing HeLa cells, treated with siRNA against control (A), APC (B) or EB1 (C), calculated from 3D images taken every 3 min for 12-min period prior to anaphase onset. Distances in taxol-treated metaphase cells are plotted in purple. Increasing intensities of green indicate temporal progression.
Figure 7
Figure 7
Misoriented centromeres lag in anaphase and undergo missegregation. (A) Plot of Shannon entropy values associated with k−k axis orientation in single siRNA-treated cells 90 s prior to anaphase and the number of lagging chromosomes that appeared subsequently in anaphase. (B) Rendered images of 5-μm-thick section acquired every 90 s in a CENPB-GFP-expressing cell treated with EB1 siRNA. Orange arrows mark lagging centromeres. (C) Three times enlarged image details k−k axes (red) with bold lines projected out of plane and thin lines parallel to plane. Bar graph shows the contribution of individual k−k axes to optimized direction at t=4:30 min; S indicates Shannon entropy value. (D) Rendered images of 5-μm-thick section acquired every 3 min in a CENPB-GFP-expressing cell treated with EB1 siRNA (orange and red arrows mark lagging kinetochores). Far right panel is 0:6:82 rotated and eight times enlarged; arrows mark unseparated pair. 1 unit=3 μm.
Figure 8
Figure 8
Speculative model for disordered metaphase plate. Schematics show the relationship between ordered congression and kinetochore orientation and stretching. We speculate that in EB1- or APC-depleted cells, the disruption of +end MT dynamics associated with kinetochore oscillations, perturb the orientation and stretching of centromeres.

References

    1. Aist JR, Liang H, Berns MW (1993) Astral and spindle forces in PtK2 cells during anaphase B: a laser microbeam study. J Cell Sci 104 (Part 4): 1207–1216 - PubMed
    1. Akhmanova A, Hoogenraad CC (2005) Microtubule plus-end-tracking proteins: mechanisms and functions. Curr Opin Cell Biol 17: 47–54 - PubMed
    1. Alter O, Brown PO, Botstein D (2000) Singular value decomposition for genome-wide expression data processing and modeling. Proc Natl Acad Sci USA 97: 10101–10106 - PMC - PubMed
    1. Asakawa K, Toya M, Sato M, Kanai M, Kume K, Goshima T, Garcia MA, Hirata D, Toda T (2005) Mal3, the fission yeast EB1 homologue, cooperates with Bub1 spindle checkpoint to prevent monopolar attachment. EMBO Rep 6: 1194–1200 - PMC - PubMed
    1. Askham JM, Vaughan KT, Goodson HV, Morrison EE (2002) Evidence that an interaction between EB1 and p150(Glued) is required for the formation and maintenance of a radial microtubule array anchored at the centrosome. Mol Biol Cell 13: 3627–3645 - PMC - PubMed

Publication types

Substances