. 2006 Jun 9:5:26.
doi: 10.1186/1476-072X-5-26.

Method for mapping population-based case-control studies: an application using generalized additive models

Affiliations

Method for mapping population-based case-control studies: an application using generalized additive models

Thomas Webster et al. Int J Health Geogr. .

Abstract

Background: Mapping spatial distributions of disease occurrence and risk can serve as a useful tool for identifying exposures of public health concern. Disease registry data are often mapped by town or county of diagnosis and contain limited data on covariates. These maps often possess poor spatial resolution, the potential for spatial confounding, and the inability to consider latency. Population-based case-control studies can provide detailed information on residential history and covariates.

Results: Generalized additive models (GAMs) provide a useful framework for mapping point-based epidemiologic data. Smoothing on location while controlling for covariates produces adjusted maps. We generate maps of odds ratios using the entire study area as a reference. We smooth using a locally weighted regression smoother (loess), a method that combines the advantages of nearest neighbor and kernel methods. We choose an optimal degree of smoothing by minimizing Akaike's Information Criterion. We use a deviance-based test to assess the overall importance of location in the model and pointwise permutation tests to locate regions of significantly increased or decreased risk. The method is illustrated with synthetic data and data from a population-based case-control study, using S-Plus and ArcView software.

Conclusion: Our goal is to develop practical methods for mapping population-based case-control and cohort studies. The method described here performs well for our synthetic data, reproducing important features of the data and adequately controlling the covariate. When applied to the population-based case-control data set, the method suggests spatial confounding and identifies statistically significant areas of increased and decreased odds ratios.


Figures

Figure 1
Figure 1
Point map of synthetic data. Locations of cases (red) and controls (blue) are shown stratified by a dichotomous variable (age). Disease odds are constant within strata, but four times higher in the old. Young are uniformly distributed; old are clustered in the northeast quadrant.
Figure 2
Figure 2
Effect of span size on crude odds ratio map. We use a generalized additive model to estimate smoothed log odds as a function of space and converted to odds ratios using the whole population as a reference. An optimal span of 0.55, chosen by minimizing the AIC, shows the correct underlying pattern, a single area of elevated disease in the northeast quadrant. Under-smoothing (left) or over-smoothing (right) distorts the pattern.
Figure 3
Figure 3
Global test of location using deviance. We test the global nullhypothesis of no association between location and disease status using the difference in deviance of models with and without the location term. We estimate the distribution of the statistic under the null hypothesis by permutation. The approximate chi-square distribution is also shown. The observed value of the deviance statistic is highly significant for the crude model (p < .0001) indicating that location is important, i.e., the crude map is not flat.
Figure 4
Figure 4
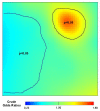
Pointwise p-values. We permuted the locations of subjects and reran the GAM model 999 times to estimate the distribution of log odds under the null hypothesis at each point. We define areas of significantly decreased odds ("cold spots") to include all points that rank in the lower 2.5% of the pointwise permutation distribution and areas of elevated odds ("hot spots") to include all points that rank in the upper 2.5% of the pointwise permutation distribution. We superimpose the 2.5% and 97.5% contour lines on the point estimate map. The slightly elevated, but non-significant, region in the lower right corner occurred due to chance.
Figure 5
Figure 5
The GAM model properly adjusts for a covariate. The crude map ofthe synthetic data is elevated in the northeast quadrant due to spatial confounding, i.e., spatial clustering of the risk factor age. Adjustment for age produced a quite flat map, an expected result since we constructed the data assuming uniform disease odds within each stratum.
Figure 6
Figure 6
Testing for edge effects. GAMs can produce biased estimates near edges. We cut our data set in half diagonally and reran the model with the same span. The results are quite similar.
Figure 7
Figure 7
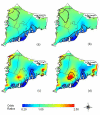
Cape Cod Breast Cancer Data. Twenty years oflatency. Odds ratios are relative to the whole study area. a) Crude, optimal span of 35%. b) Adjusted, optimal span of 35%. Adjusting for race makes little difference in the map at a span of 35%. c) Crude, span of 15%. A smaller span reveals hot spots not apparent at the larger span. d) Adjusted, span of 15%. Difference from the crude map indicates spatial confounding by race using the smaller span size.
Figure 8
Figure 8
Choosing an optimal span size. Care must be used with automatic span selection procedures. Since the Cape Cod data showed both local and global minima for the AIC, searching from the left to find the first minimum underestimated the true optimum. More importantly, the AIC and other similar methods balance bias with variance, a goal not necessarily equivalent to locating important data features.

References

    1. Blot WJ, Fraumeni JF., Jr Geographic patterns of lung cancer: Industrial correlations. American Journal of Epidemiology. 1976;103:539–550. - PubMed
    1. Polissar L. The effect of migration on comparison of disease rates in geographic studies in the United States. American Journal of Epidemiology. 1980;111:175–182. - PubMed
    1. Monmonier M. Cartographies of Danger: Mapping Hazards in America. University of Chicago Press: Chicago; 1997.
    1. Rothman K, Greenland S. Modern Epidemiology. 2. Lippincott-Raven: Philadelphia; 1998.
    1. Hastie TJ, Tibshirani RJ. Generalized Additive Models. Chapman and Hall: London; 1990.

Publication types

LinkOut - more resources