. 2006 Aug 11;281(32):22917-32.
doi: 10.1074/jbc.M605418200. Epub 2006 Jun 9.

Translation initiation factor eIF4G-1 binds to eIF3 through the eIF3e subunit

Affiliations

Translation initiation factor eIF4G-1 binds to eIF3 through the eIF3e subunit

Aaron K LeFebvre et al. J Biol Chem. .

Abstract

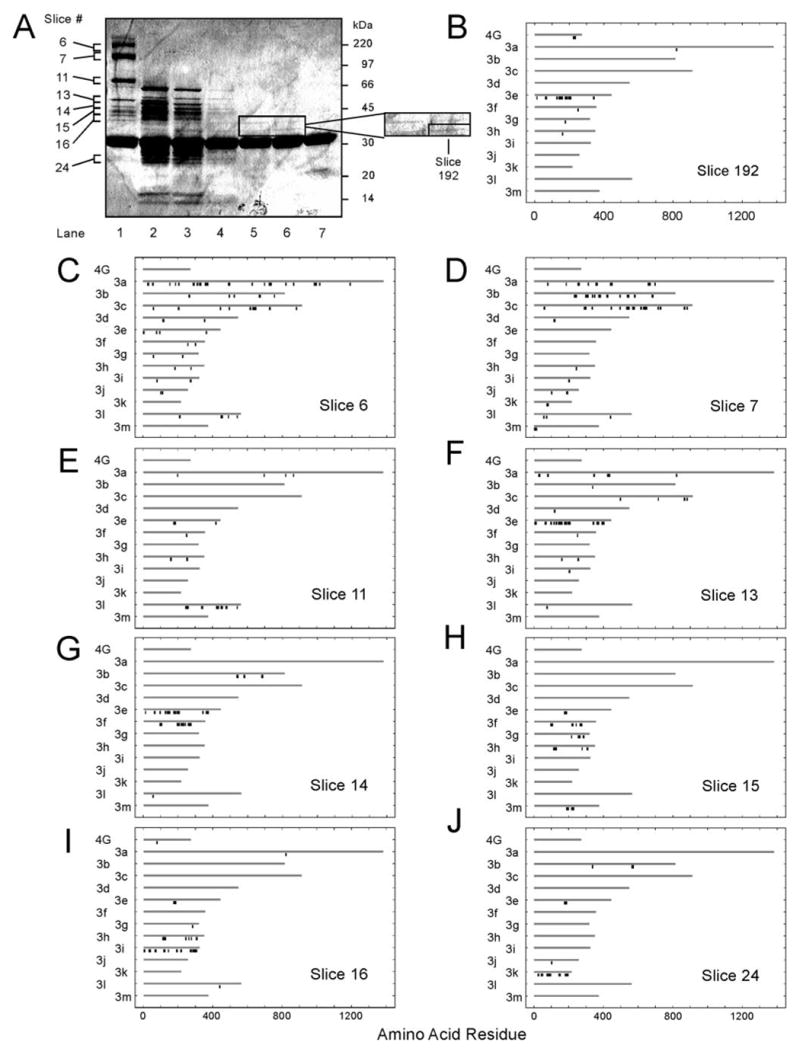
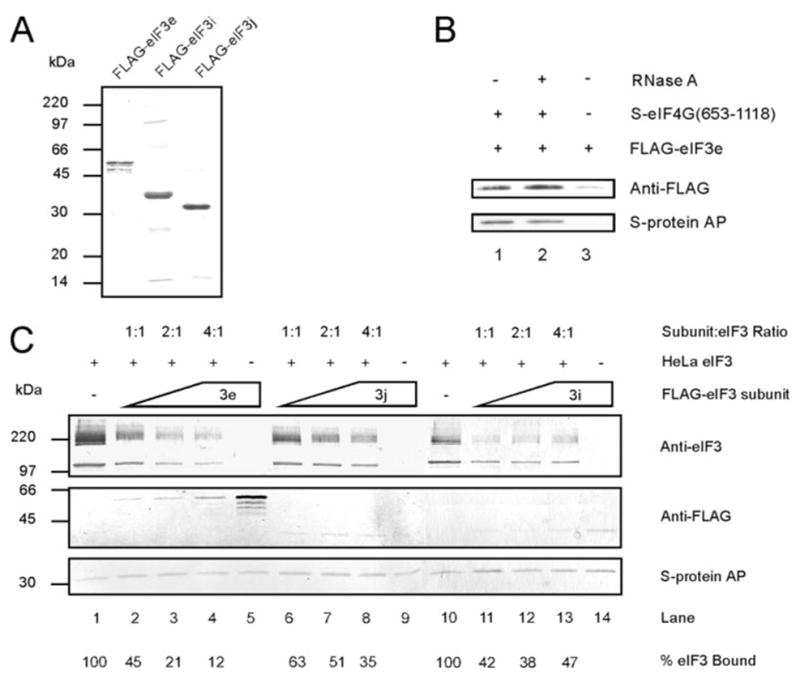
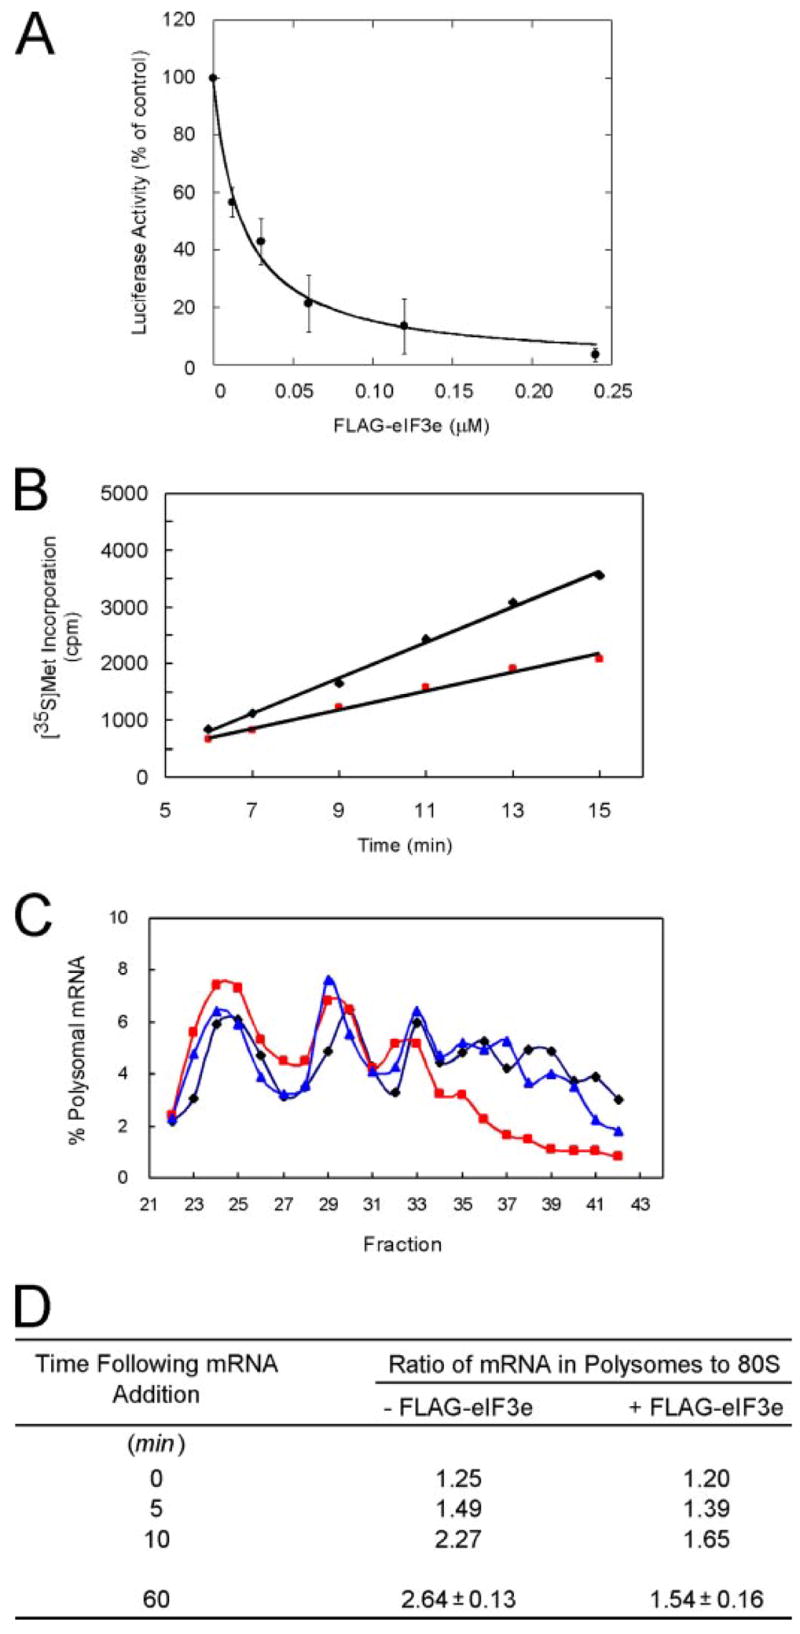
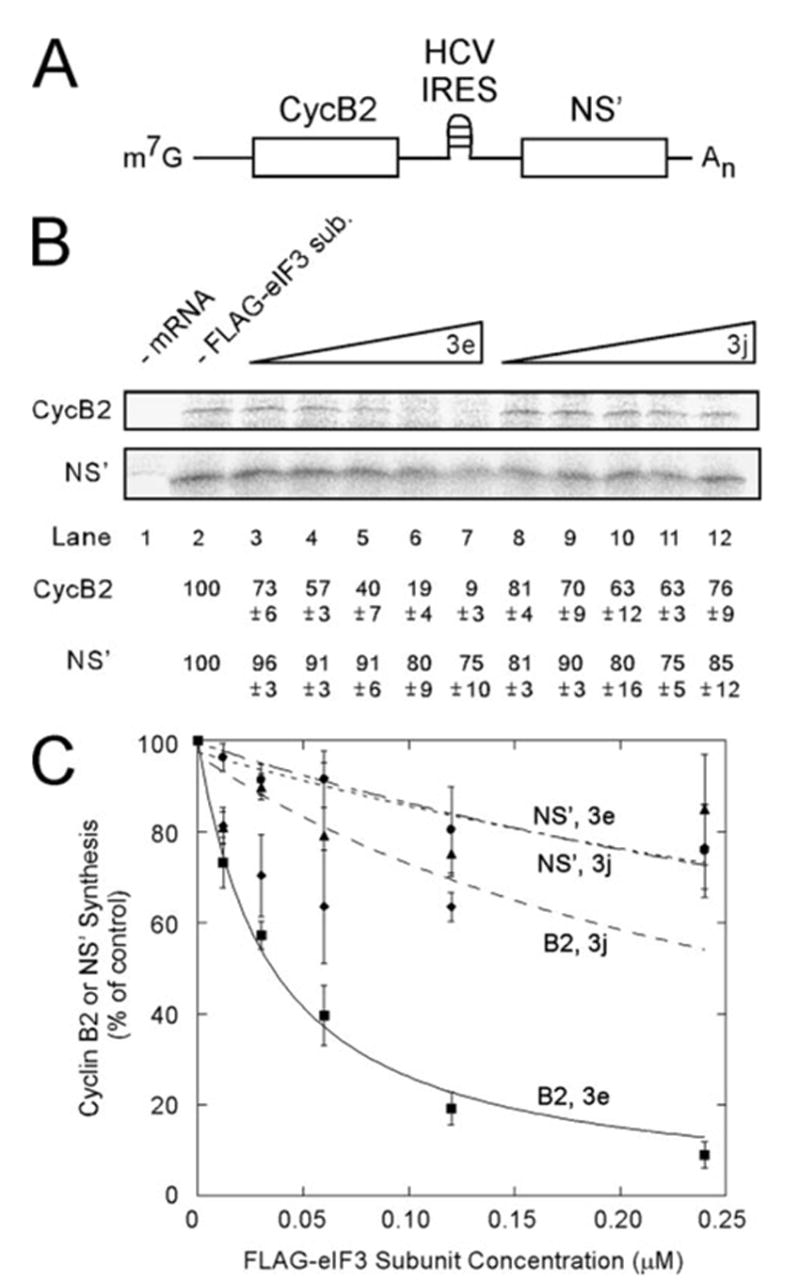
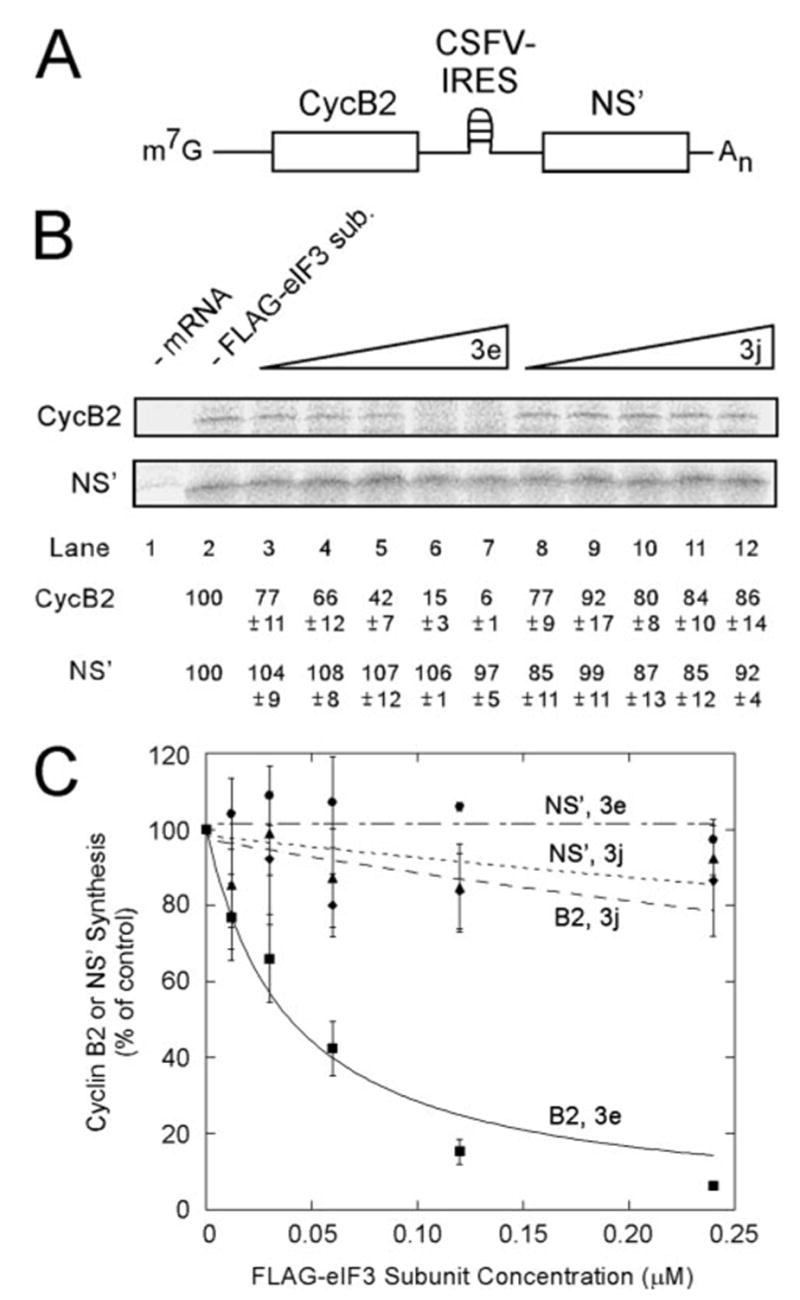
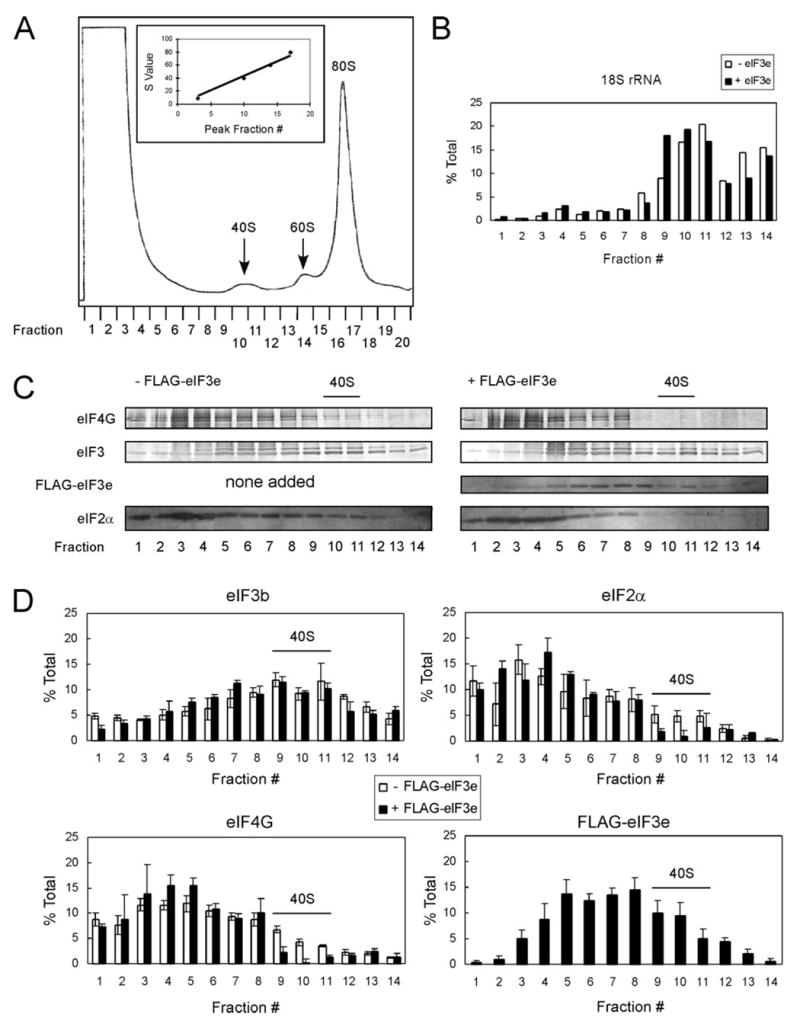
eIF3 in mammals is the largest translation initiation factor ( approximately 800 kDa) and is composed of 13 nonidentical subunits designated eIF3a-m. The role of mammalian eIF3 in assembly of the 48 S complex occurs through high affinity binding to eIF4G. Interactions of eIF4G with eIF4E, eIF4A, eIF3, poly(A)-binding protein, and Mnk1/2 have been mapped to discrete domains on eIF4G, and conversely, the eIF4G-binding sites on all but one of these ligands have been determined. The only eIF4G ligand for which this has not been determined is eIF3. In this study, we have sought to identify the mammalian eIF3 subunit(s) that directly interact(s) with eIF4G. Established procedures for detecting protein-protein interactions gave ambiguous results. However, binding of partially proteolyzed HeLa eIF3 to the eIF3-binding domain of human eIF4G-1, followed by high throughput analysis of mass spectrometric data with a novel peptide matching algorithm, identified a single subunit, eIF3e (p48/Int-6). In addition, recombinant FLAG-eIF3e specifically competed with HeLa eIF3 for binding to eIF4G in vitro. Adding FLAG-eIF3e to a cell-free translation system (i) inhibited protein synthesis, (ii) caused a shift of mRNA from heavy to light polysomes, (iii) inhibited cap-dependent translation more severely than translation dependent on the HCV or CSFV internal ribosome entry sites, which do not require eIF4G, and (iv) caused a dramatic loss of eIF4G and eIF2alpha from complexes sedimenting at approximately 40 S. These data suggest a specific, direct, and functional interaction of eIF3e with eIF4G during the process of cap-dependent translation initiation, although they do not rule out participation of other eIF3 subunits.


Figures

FIGURE 1
FIGURE 1. MALDI-TOF-MS analysis of S-eIF4G(1015–1118)-bound tryptic fragments of eIF3
A, binding of partially trypsinized HeLa eIF3 to S-eIF4G(1015–1118). eIF3 was incubated with trypsin as described under ”Experimental Procedures.“ Untrypsinized eIF3 (lane 1), aliquots of the eIF3 tryptic digest from 2 min (lane 2), 5 min (lane 3), 15 min (lane 4), 30 min (lane 5), and 60 min (lane 6), as well as an equivalent reaction without eIF3 (60 min; lane 7) were incubated with S-eIF4G(1015–1118) as described under ”Experimental Procedures“ and analyzed by SDS-PAGE with Coomassie Blue staining. B–J, MALDI-TOF-MS analysis of lane 1 (C–J) and lane 6 (B). Each lane was cut into ~2-mm slices, digested to completion with trypsin, and peptides analyzed by MALDI-TOF-MS as described under ”Experimental Procedures.“ Matched peptides (black bars) are shown below the polypeptides (gray bars) from which they are derived. The x-axis identifies the amino acid location in the sequence. The peptide mapping outputs of selected gel slices (A) are shown in B–J. GenBankTM accession numbers for amino acid sequences corresponding to eIF3 subunits are as follows: eIF3a (Q14152), eIF3b (P55884), eIF3c (Q99613), eIF3d (O15371), eIF3e (P60228), eIF3f (O00303), eIF3g (O75821), eIF3h (O15372), eIF3i (Q13347), eIF3j (O75822), eIF3k (NP_037366), eIF3l (AF077207), and eIF3m (NP_006351). The amino acid sequence for recombinant S-eIF4G(1015–1118) used in this experiment in B–J (4G) was generated in Vector NTI, Suite 9.0.0 (Informax; North Bethesda, MD).
FIGURE 2
FIGURE 2. Free FLAG-eIF3e binds specifically to eIF4G in vitro in an RNA-independent manner and competes with binding of native HeLa eIF3
A, SDS-PAGE of purified FLAG-eIF3e, FLAG-eIF3i, and FLAG-eIF3j stained with Coomassie Blue. B, reactions contained 0.1 μM S-eIF4G(653–1118) and 0.4 μM FLAG-eIF3e in the absence (lane 1) or presence (lane 2) of 20 μg/μl RNase A. A control reaction contained 0.4 μM FLAG-eIF3e alone (lane 3). C, reactions contained equimolar concentrations of S-eIF4G(1015–1118) and HeLa eIF3 (0.2 μM) and increasing concentrations (0.2, 0.4, and 0.8 μM) of either FLAG-eIF3e (lanes 2– 4), FLAG-eIF3j (lanes 6 – 8), or FLAG-eIF3i (lanes 11–13). Separate reactions contained only 0.2 μM S-eIF4G(1015–1118) with either 0.8 μM FLAG-eIF3e (lane 5), FLAG-eIF3j (lane 9), or FLAG-eIF3i (lane 14). Lanes 1 and 10 contained 0.2 μM S-eIF4G(1015–1118) with 0.2 μM HeLa eIF3. The molar ratio of FLAG-eIF3 subunit to HeLa eIF3 is indicated above the lanes. The amount of eIF3 bound is displayed below the lanes as a percentage of the reaction lacking added FLAG-eIF3 subunits (lane 1 for FLAG-eIF3e and FLAG-eIF3j and lane 10 for FLAG-eIF3i). All binding reactions in B and C were performed and analyzed by Western blotting as described under ”Experimental Procedures.“ Native eIF3 subunits (eIF3a, eIF3b/c) and FLAG-tagged eIF3 subunits (FLAG-eIF3e, -eIF3i, and -eIF3j) were detected with anti-eIF3 and anti-FLAG M2 primary antibodies, respectively, and secondary antibodies coupled to alkaline phos-phatase. S-eIF4G(653–1118) and S-eIF4G(1015–1118) were detected using S-protein-coupled alkaline phosphatase.
FIGURE 3
FIGURE 3. Free FLAG-eIF3e inhibits both the rate of protein synthesis and polysomal distribution of mRNA
A, FLAG-eIF3e inhibits luciferase synthesis from m7G-Luc-A60. Translation reactions were programmed with m7G-Luc-A60 at a final concentration of 0.5 μg/ml in the presence of the indicated concentrations of FLAG-eIF3e. Luciferase synthesis was measured after 60 min as described under ”Experimental Procedures“ and is expressed as a percentage of a control reaction without FLAG-eIF3e. The average of three independent experiments is plotted and curve fitting performed as described under ”Experimental Procedures,“ yielding a KI value of 0.018 ± 0.002 μM with an R2 value of 0.996. B, FLAG-eIF3e decreases the rate of luciferase synthesis in an RRL translational system. Translation reactions (75 μl) were programmed with 15 μg/ml m7G-Luc-A31 in the absence (black diamonds) or presence (red squares) of 0.03 μM FLAG-eIF3e. Aliquots of 10 μl were removed at the indicated times. 35S radioactivity was analyzed as described under ”Experimental Procedures.“ C, FLAG-eIF3e decreases the amount of m7G-Luc-A60 mRNA present in heavy polysomes. Translation reactions were preincubated for 15 min with no added eIF3 subunit (black diamonds), 0.24 μM FLAG-eIF3e (red squares), or 0.24 μM FLAG-eIF3j (blue triangles). Then 32P-labeled m7G-Luc-A60 (specific activity ~2.75 μCi/μg) was added at a final concentration of 2.0 μg/ml and incubation continued for 60 min. Polysomes were fractionated by ultracentrifugation as described under ”Experimental Procedures.“ The presence of 32P-labeled mRNA in each fraction was detected as Cerenkov radiation and is displayed as % total mRNA. D, similar experiments were performed as in C with FLAG-eIF3e, except that incubation times were for either 0, 5, 10, or 60 min following mRNA addition. The ratio of mRNA present in polysomes (disomes, trisomes, and heavy polysomes) to that in monosomes (80 S) is shown. The results for 60 min represents the average of three independent experiments.
FIGURE 4
FIGURE 4. Free FLAG-eIF3e inhibits cap-dependent translation more severely than HCV IRES-mediated translation
A, schematic representation of the bicistronic mRNA used in this experiment. B, in vitro translation from m7G-CycB2-HCV-NS′ in the presence of FLAG-eIF3e or FLAG-eIF3j. In vitro translation reactions (25 μl) contained the indicated concentrations of FLAG-eIF3e (lanes 3–7) or FLAG-eIF3j (lanes 8 –12) and m7G-CycB2-HCV-NS′ at 15 μg/ml. Control reactions contained no added mRNA (lane 1) and no added FLAG-tagged eIF3 subunits (lane 2). After a 90-min incubation, radiolabeled translation products were resolved by SDS-PAGE and detected by Phospho-rImager. The percent of product synthesized in each reaction is displayed below each lane as a percentage of the reaction without added FLAG-eIF3 subunits (lane 2). C, the average values from three independent experiments similar to B are plotted as described under ”Experimental Procedures.“ A KI of 0.035 ± 0.002 μM was determined for inhibition of cap-dependent translation by FLAG-eIF3e with an R2 value of 0.998. Squares, CycB2 with FLAG-eIF3e; circles, NS′ with FLAG-eIF3e; diamonds, CycB2 with FLAG-eIF3j; and triangles, NS′ with FLAG-eIF3j.
FIGURE 5
FIGURE 5. Free FLAG-eIF3e specifically inhibits cap-dependent translation more severely than CSFV IRES-mediated translation
The experiment was performed as in Fig. 4 except m7G-CycB2-CSFV-NS′ was used. An estimated KI of 0.0396 ± 0.0039 μM was determined for inhibition of cap-dependent translation by FLAG-eIF3e with an R2 value of 0.992.
FIGURE 6
FIGURE 6. Free FLAG-eIF3e blocks association of eIF4G and eIF2α with the 40 S ribosomal subunit
In vitro translation reactions (100 μl) with or without 0.05 μM FLAG-eIF3e were incubated for 15 min, layered on 10 –35% sucrose gradients, and centrifuged at 38,000 rpm for 5 h at 4 °C. Fractions (500 μl) were collected, and absorbance at 260 nm was monitored. A, typical absorbance profile indicating distribution of 40 S, 60 S, and 80 S complexes. Inset, plot of S values versus fraction number. B, real time PCR of 18 S rRNA present in fractions 1–14 with (filled bars) or without (open bars) FLAG-eIF3e. Data are plotted as the percent total 18 S rRNA present in each gradient. C, representative Western blots of trichloroacetic acid-precipitated protein from fractions 1 to 14 for eIF4G, eIF3, FLAG-eIF3e, and eIF2α in reactions lacking (left panel) or containing (right panel) FLAG-eIF3e. eIF4G and eIF3 blots were probed with secondary antibodies coupled to alkaline phosphatase, whereas FLAG-eIF3e and eIF2α were probed with secondary antibodies coupled to horseradish peroxidase and developed with ECL+. D, experiments similar to that in C were performed in triplicate, immunological signals quantitated using ImageQuant software, and average values plotted as the percent of total protein in fractions 1–14. The eIF3b band was used for quantitation of eIF3. Peak fractions of the 40 S ribosomal subunit, as determined in B, are indicated in C and D.

References

    1. Hershey JWB, Merrick WC. In: Translational Control of Gene Expression. Sonenberg N, Hershey JWB, Mathews MB, editors. Cold Spring Harbor Laboratory Press; Cold Spring Harbor, NY: 2000. pp. 33–88.
    1. Browning KS, Gallie DR, Hershey JW, Hinnebusch AG, Maitra U, Merrick WC, Norbury C. Trends Biochem Sci. 2001;26:284. - PubMed
    1. Morris-Desbois C, Rety S, Ferro M, Garin J, Jalinot P. J Biol Chem. 2001;276:45988–45995. - PubMed
    1. Zhou C, Arslan F, Wee S, Krishnan S, Ivanov AR, Oliva A, Leatherwood J, Wolf DA. BMC Biol. 2005;3:14. - PMC - PubMed
    1. Hinnebusch AG. In: Translational Control of Gene Expression. Sonenberg N, Hershey JWB, Mathews MB, editors. Cold Spring Harbor Laboratory Press; Cold Spring Harbor, NY: 2000. pp. 185–244.

Publication types

Substances

LinkOut - more resources