. 2006 Sep 1;91(5):1925-40.
doi: 10.1529/biophysj.105.077818. Epub 2006 Jun 9.

Resonant waveguide grating biosensor for living cell sensing

Affiliations

Resonant waveguide grating biosensor for living cell sensing

Ye Fang et al. Biophys J. .

Abstract

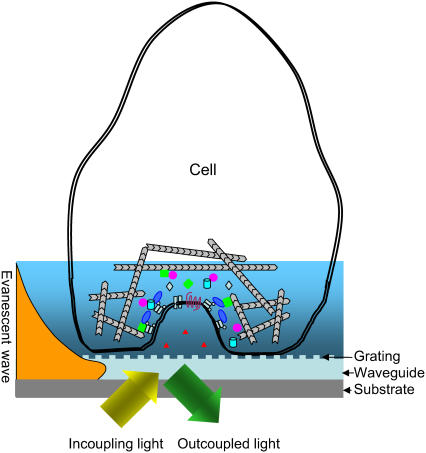
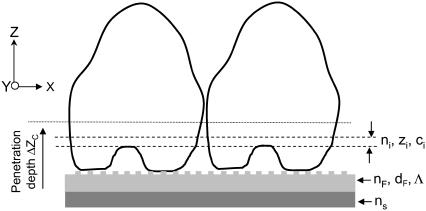
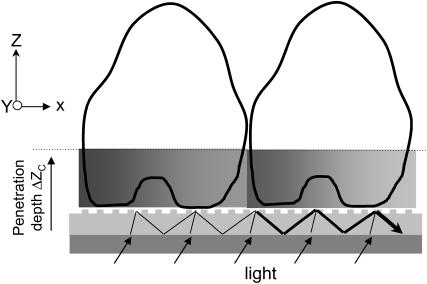
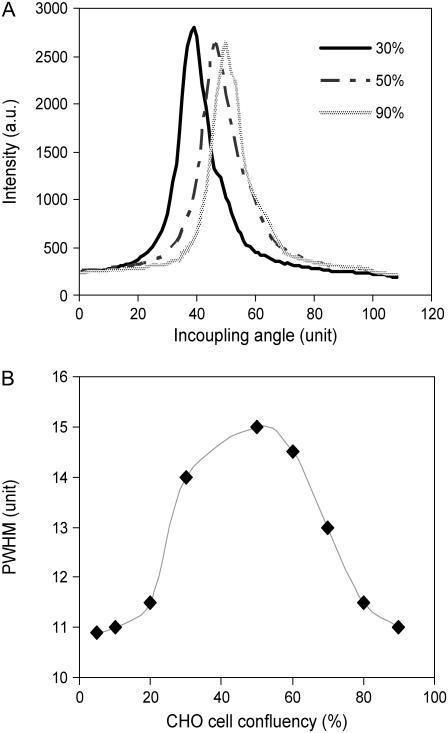
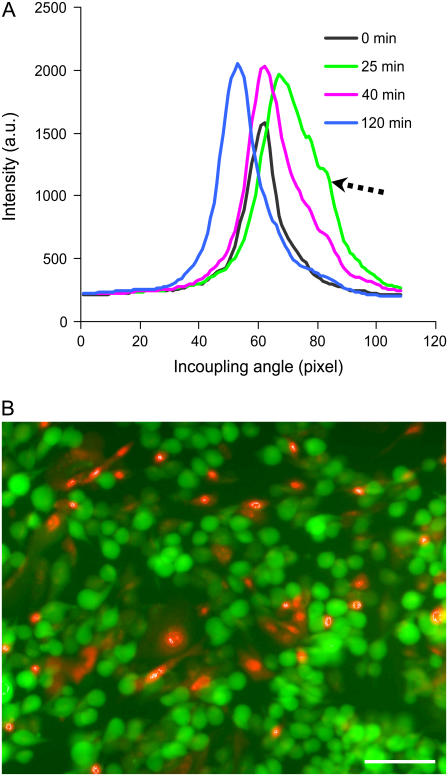
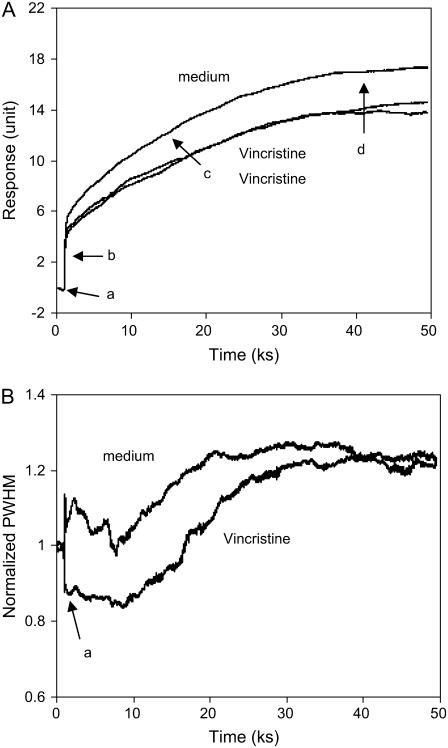
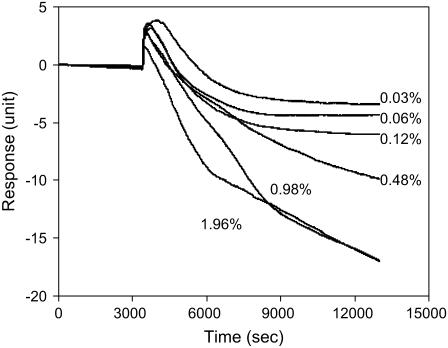
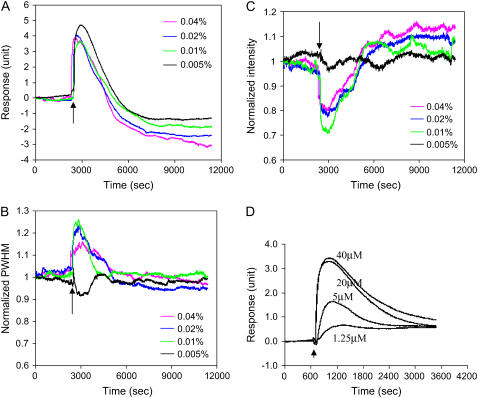
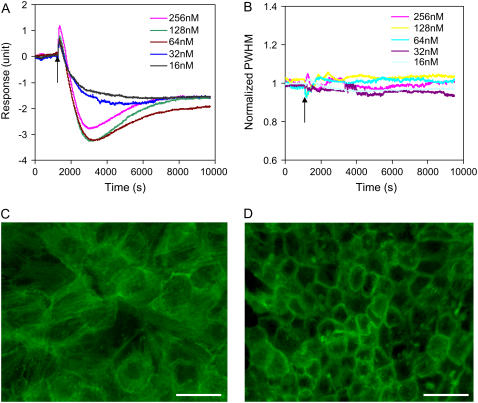
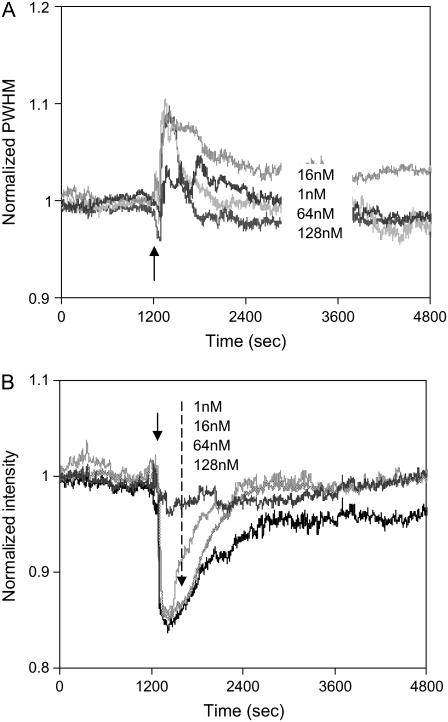
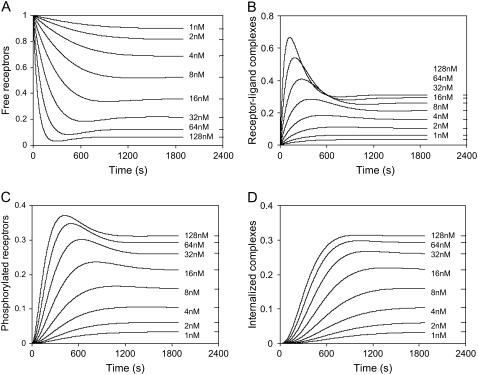
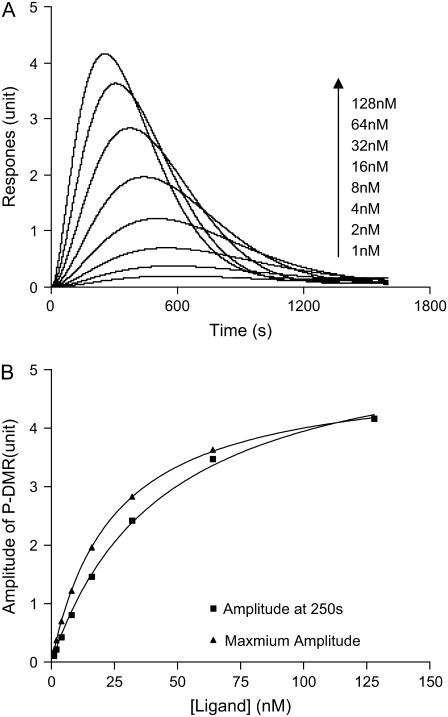
This article presents theoretical analysis and experimental data for the use of resonant waveguide grating (RWG) biosensors to characterize stimulation-mediated cell responses including signaling. The biosensor is capable of detecting redistribution of cellular contents in both directions that are perpendicular and parallel to the sensor surface. This capability relies on online monitoring cell responses with multiple optical output parameters, including the changes in incident angle and the shape of the resonant peaks. Although the changes in peak shape are mainly contributed to stimulation-modulated inhomogeneous redistribution of cellular contents parallel to the sensor surface, the shift in incident angle primarily reflects the stimulation-triggered dynamic mass redistribution (DMR) perpendicular to the sensor surface. The optical signatures are obtained and used to characterize several cellular processes including cell adhesion and spreading, detachment and signaling by trypsinization, and signaling through either epidermal growth factor receptor or bradykinin B2 receptor. A mathematical model is developed to link the bradykinin-mediated DMR signals to the dynamic relocation of intracellular proteins and the receptor internalization during B2 receptor signaling cycle. This model takes the form of a set of nonlinear, ordinary differential equations that describe the changes in four different states of B2 receptors, diffusion of proteins and receptor-protein complexes, and the DMR responses. Classical analysis shows that the system converges to a unique optical signature, whose dynamics (amplitudes, transition time, and kinetics) is dependent on the bradykinin signal input, and consistent with those observed using the RWG biosensors. This study provides fundamentals for probing living cells with the RWG biosensors, in general, optical biosensors.


Figures

FIGURE 1
FIGURE 1
The principle of RWG biosensor for sensing living cells. Cells are directly cultured onto the surface of a RWG biosensor. The mass redistribution within the bottom portion of cells, mediated by stimulus such as GPCR agonists or EGFR ligands, is directly measured with the biosensor. RWG biosensor utilizes an optical beam with an appropriate angular content to illuminate a waveguide film in which a grating structure is embedded. When this beam is reflected by the sensor surface, the resonant angle dominates in the output beam. The mass redistribution within the sensing volume alters the incident angle.
FIGURE 2
FIGURE 2
A three-layer configuration for detecting the stimulation-mediated vertical mass redistribution within the sensing volume. The bottom portion of cells is viewed to consist of multiple equal-spaced and homogenous thin layers, each layer has its own refractive index ni, protein concentration Ci, distance Zi (away from the sensor surface). A grating with a periodicity of Λ is embedded with the waveguide film with a refractive index of nF and a thickness of dF. The waveguide film is deposited on the top surface of a substrate with a refractive index of ns.
FIGURE 3
FIGURE 3
The phase shift as a function of asymmetrically lateral redistribution of cellular contents mediated by stimulation. The guided light, propagating in the planar waveguide, is viewed as zigzag waves. The inhomogeneity of lateral mass distribution within the sensing volume results in broadening, and even splitting of the resonant peak of a given mode.
FIGURE 4
FIGURE 4
The resonant peak (A) and the PWHM (B) of TM0 mode as a function of CHO cell confluency.
FIGURE 5
FIGURE 5
The effect of DMSO on adherent CHO cells. (A) The dynamic effect of 18% DMSO on the shape of the TM0 peak at a confluency of ∼80%. (B) Live/Dead staining pattern of CHO cells after treated with 18% DMSO for 25 min. The bar represents 60 μm.
FIGURE 6
FIGURE 6
Real-time monitoring the adhesion and spreading of A431 cells in the absence and presence of vincristine using the shift in incident angle (A), or the PWHM of the TM0 mode (B).
FIGURE 7
FIGURE 7
The dynamic mass redistribution of A431 cells mediated by trypsin at different doses. The final concentrations of trypsin are indicated in the graph. The arrow indicates the time when a trypsin solution is introduced.
FIGURE 8
FIGURE 8
Optical signatures of A431 cells induced by trypsin at low doses (AC), or SLIGLR-amide (D). (A) The shift in incident angle. (B) The normalized PWHM. (C) The intensity of the TM0 peak. (D) The shift in incident angle mediated by SLIGLR-amide at different doses. The arrows indicate the time when a solution is added.
FIGURE 9
FIGURE 9
The responses of quiescent A431 cells to EGF stimulation. (A) The dynamic shift in incident angle as a function of time. (B) The normalized PWHM as a function of time. (C and D) Staining pattern of actin filaments with TR-phalloid: (C) untreated A431; (D) A431 treated with 16nM EGF for 15 min. The bar represents 40 μM.
FIGURE 10
FIGURE 10
Optical signatures of quiescent A431 cells mediated through bradykinin B2 receptor by bradykinin: the PWHM (A) and the intensity (B) of the resonant peak of the TM0 mode. The arrows indicate the time when a bradykinin solution is added.
FIGURE 11
FIGURE 11
The dynamics of four different states of receptors in response to different bradykinin signal input, as predicted by the model. (a) The number of free receptors at the cell surface; (b) the number of receptor-ligand complexes at the cell surface; (c) the number phosphorylated receptors at the cell surface; and (d) the number of internalized receptor complexes. The total number of receptors was normalized to 1.
FIGURE 12
FIGURE 12
The DMR signals mediated by bradykinin, as predicted by the model. (A) The responses as a function of time and bradykinin concentration. (B) Two types of amplitudes of the P-DMR phase, obtained at a given time (250 s) after stimulation or the maximum level, as a function of bradykinin concentrations. The change in effective index of the cell layer is calculated and normalized to the unit measured using the present optical sensor system.

References

    1. Blake, R. A. 2001. Cellular screening assays using fluorescence microscopy. Curr. Opin. Pharmacol. 1:533–538. - PubMed
    1. Taylor, D. L., E. S. Woo, and K. A. Giuliano. 2001. Real-time molecular and cellular analysis: the new frontier of drug discovery. Curr. Opin. Biotechnol. 12:75–81. - PubMed
    1. Abraham, V., D. L. Taylor, and J. R. Haskins. 2004. High content screening applied to large-scale cell biology. Trends Biotechnol. 22:15–22. - PubMed
    1. Gribbon, P., and A. Sewing. 2003. Fluorescence readouts in HTS: no gain without pain? Drug Discov. Today. 8:1035–1043. - PubMed
    1. Balla, T., and P. Varnai. 2002. Visualizing cellular phosphoinositide pools with GFP-fused protein-modules. Sci. STKE. 125:pI3. - PubMed

MeSH terms