Dynamic deformation and recovery response of red blood cells to a cyclically reversing shear flow: Effects of frequency of cyclically reversing shear flow and shear stress level
- PMID: 16766612
- PMCID: PMC1544289
- DOI: 10.1529/biophysj.105.060236
Dynamic deformation and recovery response of red blood cells to a cyclically reversing shear flow: Effects of frequency of cyclically reversing shear flow and shear stress level
Abstract
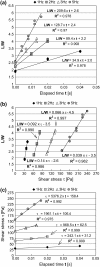
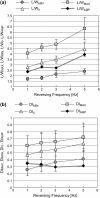
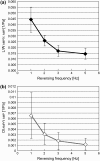
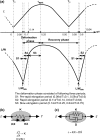
Dynamic deformation and recovery responses of red blood cells (RBCs) to a cyclically reversing shear flow generated in a 30-microm clearance, with the peak shear stress of 53, 108, 161, and 274 Pa at the frequency of 1, 2, 3, and 5 Hz, respectively, were studied. The RBCs' time-varying velocity varied after the glass plate velocity without any time lag, whereas the L/W change, where L and W were the major and minor axes of RBCs' ellipsoidal shape, exhibited a rapid increase and gradual decay during the deformation and recovery phase. The time of minimum L/W occurrence lagged behind the zero-velocity time of the glass plate (zero stress), and the delay time normalized to the one-cycle duration remained constant at 8.0%. The elongation of RBCs at zero stress time became larger with the reversing frequency. A simple mechanical model consisting of an elastic linear element during a rapid elongation period and a parallel combination of elements such as a spring and dashpot during the nonlinear recovery phase was suggested. The dynamic response behavior of RBCs under a cyclically reversing shear flow was different from the conventional shape change where a steplike force was applied to and completely released from the RBCs.
Figures


Similar articles
-
Deformability of human red blood cells exposed to a uniform shear stress as measured by a cyclically reversing shear flow generator.Physiol Meas. 2007 May;28(5):531-45. doi: 10.1088/0967-3334/28/5/007. Epub 2007 Apr 20. Physiol Meas. 2007. PMID: 17470986
-
Alterations in red blood cell volume and hemoglobin concentration, viscoelastic properties, and mechanical fragility caused by continuous flow pumping in calves.Artif Organs. 2011 Aug;35(8):791-9. doi: 10.1111/j.1525-1594.2011.01317.x. Artif Organs. 2011. PMID: 21843294
-
The deformation behavior of multiple red blood cells in a capillary vessel.J Biomech Eng. 2009 Jul;131(7):074504. doi: 10.1115/1.3127255. J Biomech Eng. 2009. PMID: 19640140
-
Computational Biomechanics of Human Red Blood Cells in Hematological Disorders.J Biomech Eng. 2017 Feb 1;139(2):0210081-02100813. doi: 10.1115/1.4035120. J Biomech Eng. 2017. PMID: 27814430 Free PMC article. Review.
-
Red blood cell flow in the cardiovascular system: a fluid dynamics perspective.Crit Rev Biomed Eng. 2012;40(5):427-40. doi: 10.1615/critrevbiomedeng.v40.i5.30. Crit Rev Biomed Eng. 2012. PMID: 23339650 Review.
Cited by
-
Yield strength of human erythrocyte membranes to impulsive stretching.Biophys J. 2013 Aug 20;105(4):872-9. doi: 10.1016/j.bpj.2013.06.045. Biophys J. 2013. PMID: 23972839 Free PMC article.
-
Erythrocyte morphological symmetry analysis to detect sublethal trauma in shear flow.Sci Rep. 2021 Dec 7;11(1):23566. doi: 10.1038/s41598-021-02936-2. Sci Rep. 2021. PMID: 34876652 Free PMC article.
-
Erythrocyte Aging, Protection via Vesiculation: An Analysis Methodology via Oscillatory Flow.Front Physiol. 2018 Nov 16;9:1607. doi: 10.3389/fphys.2018.01607. eCollection 2018. Front Physiol. 2018. PMID: 30505281 Free PMC article.
-
Mechanical response of red blood cells entering a constriction.Biomicrofluidics. 2014 Dec 11;8(6):064123. doi: 10.1063/1.4904058. eCollection 2014 Nov. Biomicrofluidics. 2014. PMID: 25553197 Free PMC article.
-
Full dynamics of a red blood cell in shear flow.Proc Natl Acad Sci U S A. 2012 Dec 18;109(51):20808-13. doi: 10.1073/pnas.1210236109. Epub 2012 Dec 3. Proc Natl Acad Sci U S A. 2012. PMID: 23213229 Free PMC article.
References
-
- Skalak, R., and P.-I. Brånemark. 1969. Deformation of red blood cells in capillaries. Science. 164:717–719. - PubMed
-
- Schmid-Schönbein, H., and R. Wells. 1969. Fluid drop-like transition of erythrocytes under shear. Science. 165:288–291. - PubMed
-
- Fischer, T., and H. Schmid-Schönbein. 1977. Tank tread motion of red cell membranes in viscometric flow: behavior of intracellular and extracellular markers (with film). Blood Cells. 3:351–365.
-
- Fischer, T. M., H. Schmid-Schönbein, and M. Stöhr-Liesen. 1978. The red cell as a fluid droplet: tank tread-like motion of the human erythrocyte membrane in shear flow. Science. 202:894–896. - PubMed
-
- Fischer, T. M., M. Stöhr, and H. Schmid-Schönbein. 1978. Red blood cell (RBC) microrheology: comparison of the behavior of single RBC and liquid droplets in shear flow. Biorheology. 74:38–45.
Publication types
MeSH terms
LinkOut - more resources
Full Text Sources
Other Literature Sources

