

Random assembly of GABA rho1 and rho2 subunits in the formation of heteromeric GABA(C) receptors
- PMID: 16767514
- PMCID: PMC11520671
- DOI: 10.1007/s10571-006-9001-8
Random assembly of GABA rho1 and rho2 subunits in the formation of heteromeric GABA(C) receptors
Abstract
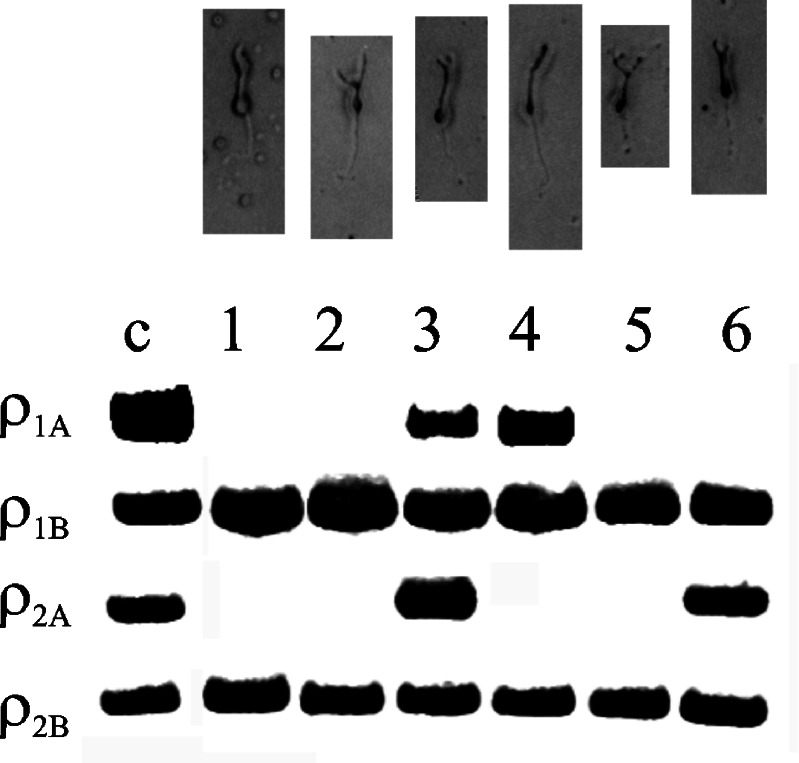
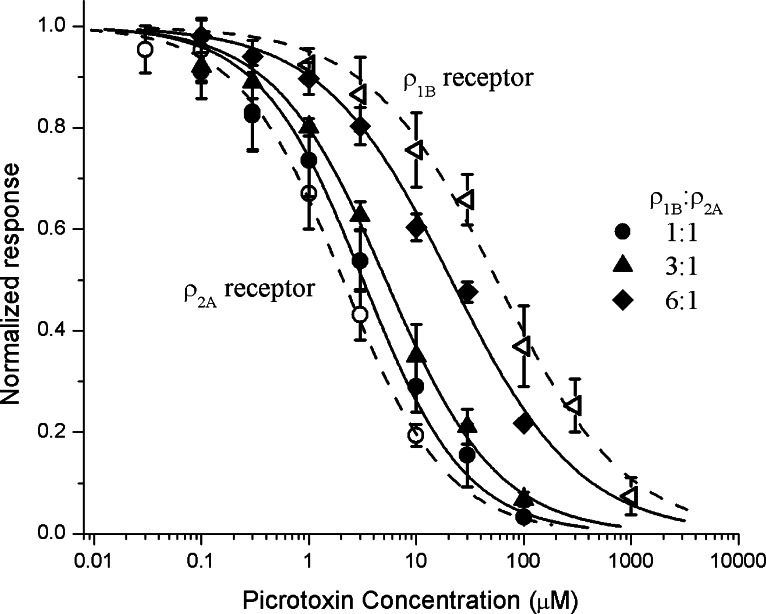
1. Various combinations of the rho subunits (rho(1A), rho(1B), rho(2A), rho(2B)) of GABA(C) receptors cloned from white perch retina were expressed in Xenopus oocytes, and electrophysiological and pharmacological methods were used to test their ability to co-assemble into heteromeric receptors. Simultaneous injection of the two subunits, irrespective of their relative proportions, led invariably to the formation of a preponderance of heteromeric receptors. 2. The GABA deactivation responses elicited from these cells could be described by a single exponential decay, and their pharmacological responses deviated significantly from those expected of a simple mixture of two homomeric rho(1) and rho(2) receptors. In contrast, a double exponential function comprising fast and slow components was required to fit the GABA deactivation responses elicited from oocytes sequentially expressing rho(1) and rho(2) subunits, a condition that favors the formation of a mixture of homomeric rho(1) and rho(2) receptors. 3. Both the GABA-response kinetics and the sensitivity to picrotoxin of the heteromeric perch rho(1B)rho(2A) receptor varied with the proportion of the subunit RNA injected, indicating there is no fixed stoichiometry for their co-assembly into heteromeric rho(1)rho(2) receptors. 4. If native GABA(C) receptors in retinal neurons behave in a similar manner as in the oocyte expression system, these finding suggest that the properties of their GABA(C) receptors are likely to be influenced by the transcription/translation efficiency of GABA rho subunit genes.
Figures


Similar articles
-
Response kinetics and pharmacological properties of heteromeric receptors formed by coassembly of GABA rho- and gamma 2-subunits.Proc Biol Sci. 1999 Dec 7;266(1436):2419-25. doi: 10.1098/rspb.1999.0941. Proc Biol Sci. 1999. PMID: 10643085 Free PMC article.
-
Interactions between rho and gamma2 subunits of the GABA receptor.J Neurochem. 2005 Jul;94(2):482-90. doi: 10.1111/j.1471-4159.2005.03225.x. J Neurochem. 2005. PMID: 15998298
-
Evidence for coassembly of mutant GABAC rho1 with GABAA gamma2S, glycine alpha1 and glycine alpha2 receptor subunits in vitro.Eur J Neurosci. 2000 Sep;12(9):3137-45. doi: 10.1046/j.1460-9568.2000.00198.x. Eur J Neurosci. 2000. PMID: 10998097
-
The GABA A receptor subunits heterologously expressed in Xenopus oocytes.Mini Rev Med Chem. 2013 Apr 1;13(5):744-8. doi: 10.2174/1389557511313050011. Mini Rev Med Chem. 2013. PMID: 23373649 Review.
-
[GABAC receptors: structure and functions].Eksp Klin Farmakol. 2011;74(1):45-9. Eksp Klin Farmakol. 2011. PMID: 21476276 Review. Russian.
Cited by
-
GABA-A channel subunit expression in human glioma correlates with tumor histology and clinical outcome.PLoS One. 2012;7(5):e37041. doi: 10.1371/journal.pone.0037041. Epub 2012 May 17. PLoS One. 2012. PMID: 22615883 Free PMC article.
-
GABA Regulates Release of Inflammatory Cytokines From Peripheral Blood Mononuclear Cells and CD4+ T Cells and Is Immunosuppressive in Type 1 Diabetes.EBioMedicine. 2018 Apr;30:283-294. doi: 10.1016/j.ebiom.2018.03.019. Epub 2018 Mar 28. EBioMedicine. 2018. PMID: 29627388 Free PMC article.
-
GABAρ subunits confer a bicuculline-insensitive component to GFAP+ cells of cerebellum.Proc Natl Acad Sci U S A. 2014 Dec 9;111(49):17522-7. doi: 10.1073/pnas.1419632111. Epub 2014 Nov 24. Proc Natl Acad Sci U S A. 2014. PMID: 25422464 Free PMC article.
-
Activation of the tonic GABAC receptor current in retinal bipolar cell terminals by nonvesicular GABA release.J Neurophysiol. 2009 Aug;102(2):691-9. doi: 10.1152/jn.00285.2009. Epub 2009 Jun 3. J Neurophysiol. 2009. PMID: 19494193 Free PMC article.
-
Pharmacological analysis of the activation and receptor properties of the tonic GABA(C)R current in retinal bipolar cell terminals.PLoS One. 2011;6(9):e24892. doi: 10.1371/journal.pone.0024892. Epub 2011 Sep 15. PLoS One. 2011. PMID: 21949779 Free PMC article.
References
-
- Alakuijala, A., TalviOja, K., Pasternack, A., and Pasternack, M. (2005). Functional characterization of rat ρ2 subunits expressed in HEK 293 cells. Eur. J. Neurosci.21:692–700. - PubMed
-
- Amin, J., and Weiss, D. S. (1996). Insights into the activation mechanism of rho1 GABA receptors obtained by coexpression of wild type and activation-impaired subunits. Proc. R. Soc. London Ser. B: Biol. Sci..263:273–282. - PubMed
-
- Barnard, E. A., Skolnick, P., Olsen, R. W., Mohler, H., Sieghart, W., Biggio, G., Braestrup, C., Bateson, A. N., and Langer, S. Z. (1998). International Union of Pharmacology. XV. Subtypes of gamma|aminobutyric acidA receptors: Classification on the basis of subunit structure and receptor function. Pharmacol. Rev..50:291–313. - PubMed
-
- Baumann, S. W., Baur, R., and Sigel, E. (2002). Forced subunit assembly in α1β2γ2 GABAA receptors. Insight into the absolute arrangement. J. Biol. Chem.277:46020–46025. - PubMed
-
- Bettler, B., Kaupmann, K., Mosbacher, J., and Gassmann, M. (2004). Molecular structure and physiological functions of GABAB receptors. Physiol. Rev.84:835–867. - PubMed
Publication types
MeSH terms
Substances
Grants and funding
LinkOut - more resources
Full Text Sources
