. 2006 Jul 7;273(1594):1697-704.
doi: 10.1098/rspb.2006.3511.

Role of avidity and breadth of the CD4 T cell response in progression to AIDS

Affiliations

Role of avidity and breadth of the CD4 T cell response in progression to AIDS

Hester Korthals Altes et al. Proc Biol Sci. .

Abstract

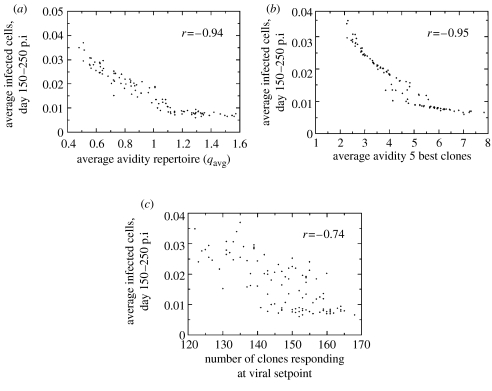
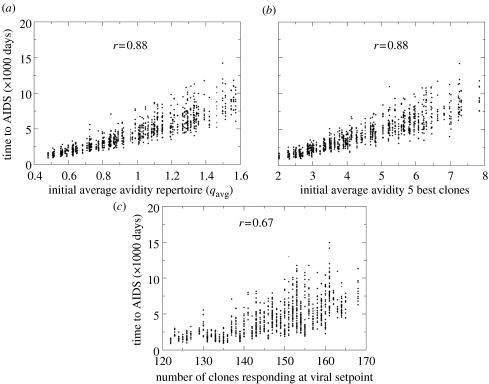
The great variability in the time between infection with HIV and the onset of AIDS has been the object of intense study. In the current work, we examine a mathematical model that focuses on the role of immune response variability between patients. We study the effect of variation in both the avidity and the breadth of the immune response on within-patient disease dynamics, viral setpoint and time to AIDS. We conclude that immune response variability can explain the observed variability in disease progression to a large extent. It turns out that the avidity, more than the breadth of the immune response, determines disease progression, and that the average avidity of the five best clones is a much better correlate for disease progression than the total number of clones responding. For the design of vaccines, this would suggest that, if given the choice between stimulating a broader, but average avidity response or a narrower high-avidity response, the latter option would yield better control of virus load and consequently slow down disease progression.


Figures

Figure 1
Figure 1
Per capita T cell proliferation rate as a function of antigen (αqiI/(γ+qiI)), for immune response avidity qi=0.5 (continuous line) and avidity qi=1.5 (dashed line). Proliferation rate is half-maximal (α/2) for I=γ/qi. Parameter values are α=0.4 d−1 and γ=1 cell mm−3.
Figure 2
Figure 2
Disease progression in patients with different average avidities of their HIV-specific T cell repertoire. Parameters values: σ=2 cells mm−3 d−1, δT=0.05 d−1, σH=10−5 cells mm−3 d−1, α=0.4 d−1, β=0.04 cells−1 mm3 d−1, ϵ=0.1 cells−1 mm3 d−1, δH=0.01 d−1, δI=0.2 d−1, γ=1 cell mm−3, k=0.3 cells−1 mm3 d−1; the probability of escape mutations arising per day in a given epitope is pESC=infected cells/35. Values for the parameters and variables are based on a ‘total body model’, and rescaled to a volume of 1 mm3. qi is dimensionless; γ/qi represents the number of cells mm−3 required for half-maximal proliferation. p.i, post infection. Colour coding: target cells, black; infected cells, red; total helper cells, light green; number of clones responding, purple; average avidity immune response, orange; avidity of the best clone, blue. AIDS corresponds to the state without immune response, with high-viral load (more than 8 cells mm−3) and low target cell numbers. (a) Low repertoire avidity, qavg=0.5. Fast progressor: AIDS occurs after about 3.5 years. (b) Medium repertoire avidity, qavg=1.0. Intermediate progressor: onset of AIDS at about 12 years. (c) High-repertoire avidity, qavg=1.5. Slow progressor: AIDS after more than 17 years. (d) Primary infection phase (first 250 days) of the individual shown in figure 2b.
Figure 3
Figure 3
HIV infection simulated in 100 patients with different average immune response avidities, but with the same number of HIV-specific clones. Viral setpoint was determined by averaging the number of infected cells per day, between day 150 and 250. We also monitored the breadth of the response at day 250. As a definition of a clone's activity, we used a threshold value of 10−3cells mm−3, which corresponds to values above the ‘naive state’ of a clone (the equilibrium of T helper cell clones in the absence of infection is approximately σH/δH). Correlation coefficients indicated with r. Parameters as in figure 2, with qavg drawn randomly between 0.5 and 1.5. Initial conditions on the variables: H0=9.9×10⁻⁴ cell mm−3, T0=40 cells mm−3 and I0=1 cell mm−3. Viral setpoint plotted against: (a) average avidity of the HIV-specific CD4 T cell repertoire. (b) average avidity of the five dominant clones. (c) breadth of the HIV-specific CD4 T cell response at viral setpoint (at 250 days). Viral setpoint is negatively correlated with the breadth of the immune response, and with the average quality of the five best clones and of the whole repertoire.
Figure 4
Figure 4
Disease progression simulated in 100 patients, with 10 different possible courses of disease per patient (using different random seeds for the escape process, but starting with the same immune repertoire and, consequently, viral setpoint). Parameters as in figure 2. Correlation coefficients indicated with r. Time to AIDS plotted against: (a) average avidity of the HIV-specific CD4 T cell repertoire. (b) average avidity of the five dominant clones. (c) breadth of the HIV-specific CD4 T cell response at viral setpoint (at 250 days).

References

    1. Addo M.M, et al. Comprehensive epitope analysis of human immunodeficiency virus type 1 (HIV-1)-specific T-cell responses directed against the entire expressed HIV-1 genome demonstrate broadly directed responses, but no correlation to viral load. J. Virol. 2003;77:2081–2092. 10.1128/JVI.77.3.2081-2092.2003 - DOI - PMC - PubMed
    1. Bacchetti P, Moss A.R. Incubation period of AIDS in San Francisco. Nature. 1989;338:251–253. 10.1038/338251a0 - DOI - PubMed
    1. Betts M.R, Casazza J.P, Patterson B.A, Waldrop S, Trigona W, Fu T.M, Kern F, Picker L.J, Koup R.A. Putative immunodominant human immunodeficiency virus-specific CD8(+) T-cell responses cannot be predicted by major histocompatibility complex class I haplotype. J. Virol. 2000;74:9144–9151. 10.1128/JVI.74.19.9144-9151.2000 - DOI - PMC - PubMed
    1. Betts M.R, Ambrozak D.R, Douek D.C, Bonhoeffer S, Brenchley J.M, Casazza J.P, Koup R.A, Picker L.J. Analysis of total human immunodeficiency virus (HIV)-specific CD4(+) and CD8(+) T-cell responses: relationship to viral load in untreated HIV infection. J. Virol. 2001a;75:11 983–11 991. 10.1128/JVI.75.24.11983-11991.2001 - DOI - PMC - PubMed
    1. Betts M.R, Casazza J.P, Koup R.A. Monitoring HIV-specific CD8+T cell responses by intracellular cytokine production. Immunol. Lett. 2001b;79:117–125. 10.1016/S0165-2478(01)00273-5 - DOI - PubMed

Publication types

MeSH terms