. 2006 Jul;128(1):45-54.
doi: 10.1085/jgp.200609545. Epub 2006 Jun 12.

The changes in Ca2+ sparks associated with measured modifications of intra-store Ca2+ concentration in skeletal muscle

Affiliations

The changes in Ca2+ sparks associated with measured modifications of intra-store Ca2+ concentration in skeletal muscle

Bradley S Launikonis et al. J Gen Physiol. 2006 Jul.

Abstract

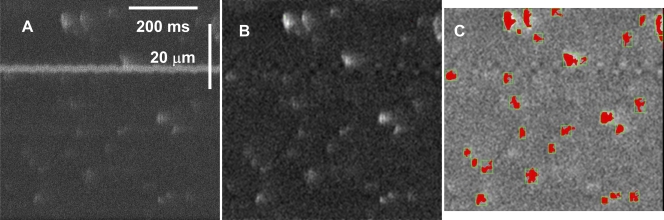
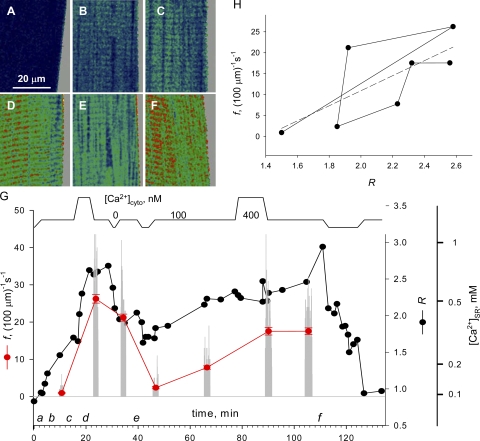
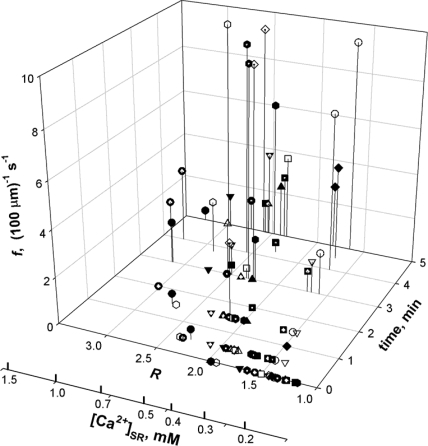
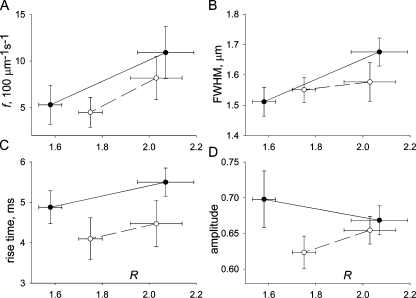
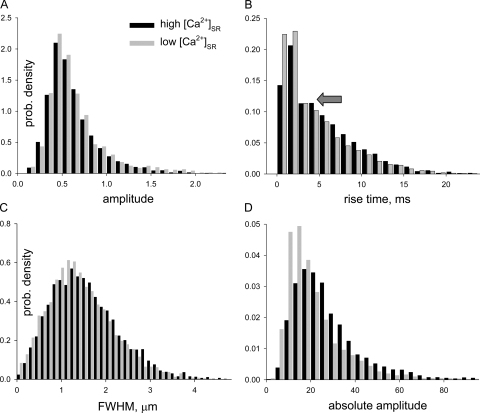
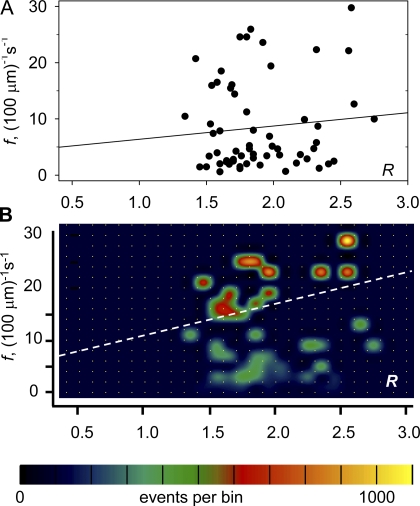
In cardiac muscle and amphibian skeletal muscle, the intracellular Ca2+ release that signals contractile activation proceeds by discrete local packets, which result in Ca2+ sparks. The remarkably stereotyped duration of these release events requires a robustly timed termination mechanism. In cardiac muscle the mechanism of spark termination appears to crucially involve depletion of Ca2+ in the lumen of the sarcoplasmic reticulum (SR), but in skeletal muscle, the mechanism is unknown. We used SEER (shifted excitation and emission ratioing of fluorescence) of SR-trapped mag-indo-1 and confocal imaging of fluorescence of cytosolic rhod-2 to image Ca2+ sparks while reversibly changing and measuring [Ca2+] in the SR ([Ca2+]SR) of membrane-permeabilized frog skeletal muscle cells. Sparks were collected in cells immersed in a solution promoting production of events at moderate frequency. Just after permeabilization, event frequency was zero, and in 10 minutes it reached close to a steady value. Controlled interventions modified [Ca2+]SR reversibly between a low value (299 microM on average in 10 experiments) and a high value (433 microM, a 45% average increase). This change increased sparks frequency by 93%, spatial width by 7%, rise time by 10%, and peak amplitude by 38% (provided that it was calculated in absolute terms, rather than normalized by resting fluorescence). The changes in event frequency and amplitude were statistically significant. The "strength" of the effect of [Ca2+]SR on frequency, quantified by decomposition of variance, was <6%. While the average change in [Ca2+]SR was limited, it reached up to 200% in individual fibers, without causing massive Ca2+ release or an increase of >3.5-fold in event frequency. Taken together with existing evidence that depletion is modest during Ca2+ sparks or release elicited by an action potential, the mild effects of [Ca2+]SR reported here do not support a major role of depletion in either the termination of sparks or the strong inactivation that terminates Ca2+ release at the global level in frog skeletal muscle.


Figures

Figure 1.
Figure 1.
Performance of the automatic detector. The panels illustrate three stages of detection: A, the raw image, with several features that may cause detection problems, including high frequency of relatively small events, one large steady inhomogeneity, and noise; B, the bleaching-corrected, normalized, band pass–filtered image, which is subjected to the detection algorithm; C, normalized image, with red areas marking the suprathreshold “footprints” of events that passed all validation criteria described in the text. Spatial “margins” where filtering is imperfect due to edge effects are omitted in the final detection analysis. Identifier 061004a, image 125 ([Ca2+]SR was 0.7 mM).
Figure 2.
Figure 2.
Interventions that change [Ca2+]SR. (A–F) Representative SEER ratio images of fluorescence of mag-indo-1 trapped inside organelles of a membrane-permeabilized muscle fiber. (G, top) Schematic representation of [Ca2+] in perfusing solutions, including the reference (100 nM), a high Ca2+ saline (400 nM) and relaxing solution (∼10 nM). Black symbols and lines plot R, SEER ratio averaged over well-stained regions of the image. Gray bars, the frequency of sparks detected in individual line scan images. Red symbols, f, average spark frequency (±SEM) within series of 50 line scan images. Right offset axis, [Ca2+] corresponding to R. Identifier: 061004a.
Figure 3.
Figure 3.
Early evolution of spark frequency. f, computed in x-y scans, as a function of time after membrane permeabilization and average of R in simultaneous line-interleaved x-y images. Different symbols correspond to different experiments (19 fibers).
Figure 4.
Figure 4.
Spark parameters at different [Ca2+]SR. (A) Averages over all fibers of R vs. f in four conditions: filled symbols, before or after exposure to high [Ca2+]cyto; open symbols, before or after exposure to relaxing solution. (B–D) Averages of morphologic spark parameters, first computed for individual fibers (n = 10), and then averaged over fibers and plotted as described for A. Bars represent the standard error of the mean over fibers.
Figure 5.
Figure 5.
Effects of [Ca2+]SR on morphologic spark parameters. Histograms of parameter values of individual sparks in all fibers included in Table II. Black bars represent the high [Ca2+]SR condition and gray bars the low [Ca2+]SR condition. (A) Histogram of conventionally defined amplitudes. (B) Histogram of rise times. The arrow marks a minor mode, visible in this histogram in both conditions. (C) Histogram of FWHM. (D) Histogram of absolute amplitudes, calculated as described in Materials and Methods. Note that the histogram of absolute amplitudes changes with [Ca2+]SR, whereas that of conventionally defined amplitudes does not.
Figure 6.
Figure 6.
The correlation of [Ca2+]SR and event frequency. (A) Each data point represents a series of 50 images by the average of two measurements of R, which bracket the series, vs. the series-averaged event frequency f. The first order regression line has slope 2.35 (100 μm)−1s−1 and intercept 4.04 (100 μm)−1s−1. r is 0.10. (B) The joint histogram of R and f in individual events. Every event in a series is given the same values of R and f. The histogram is different from zero only in bins containing the pairs of values plotted in A. Bin frequency is encoded in color and interpolated for visibility as described by González et al., (2000). The regression line has slope 5.28 (100 μm)−1s−1 and intercept 5.35 (100 μm)−1s−1. r is 0.24. By weighing every event equally, the regression in B uncovers a positive correlation between the variables.

References

    1. Baylor, S.M., W.K. Chandler, and M.W. Marshall. 1983. Sarcoplasmic reticulum calcium release in frog skeletal muscle fibres estimated from Arsenazo III calcium transients. J. Physiol. 344:625–666. - PMC - PubMed
    1. Beard, N.A., M.G. Casarotto, L. Wei, M. Varsanyi, D.R. Laver, and A.F. Dulhunty. 2005. Regulation of ryanodine receptors by calsequestrin: effect of high luminal Ca2+ and phosphorylation. Biophys. J. 88:3444–3454. - PMC - PubMed
    1. Brochet, D.X., D. Yang, A. Di Maio, W.J. Lederer, C. Franzini-Armstrong, and H. Cheng. 2005. Ca2+ blinks: rapid nanoscopic store calcium signaling. Proc. Natl. Acad. Sci. USA. 102:3099–3104. - PMC - PubMed
    1. Cheng, H., L.S. Song, N. Shirokova, A. González, E.G. Lakatta, E. Ríos, and M.D. Stern. 1999. Amplitude distribution of calcium sparks in confocal images: theory and studies with an automatic detection method. Biophys. J. 76:606–617. - PMC - PubMed
    1. Cramér, H. 1946. Mathematical Methods of Statistics. Princeton University Press, Princeton, NJ. 467.

Publication types

MeSH terms