. 2006 Jun 20;103(25):9643-8.
doi: 10.1073/pnas.0600979103. Epub 2006 Jun 12.

The type 1 lysophosphatidic acid receptor is a target for therapy in bone metastases

Affiliations

The type 1 lysophosphatidic acid receptor is a target for therapy in bone metastases

Ahmed Boucharaba et al. Proc Natl Acad Sci U S A. .

Abstract

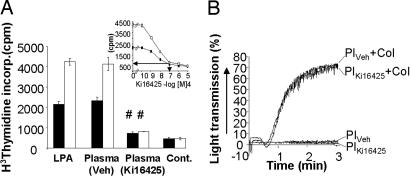
Platelet-derived lysophosphatidic acid (LPA) supports the progression of breast and ovarian cancer metastasis to bone. The mechanisms through which LPA promotes bone metastasis formation are, however, unknown. Here we report that silencing of the type 1 LPA receptor (LPA(1)) in cancer cells blocks the production of tumor-derived cytokines that are potent activators of osteoclast-mediated bone destruction and significantly reduces the progression of osteolytic bone metastases. Moreover, functional blockade of LPA action on its cognate receptor LPA(1) using a pharmacological antagonist mimics the effects of silencing LPA(1) in tumor cells in vitro and substantially reduces bone metastasis progression in animals. Overall, these results suggest that inhibition of platelet-derived LPA action on LPA(1) expressed by tumor cells may be a promising therapeutic target for patients with bone metastases.


Conflict of interest statement

Conflict of interest statement: No conflicts declared.

Figures

Fig. 1.
Fig. 1.
Effect of silencing of LPA1 expression in CHOβ3wt and MDA-BO2/GFP cells on osteolytic lesions and skeletal TB. (A) Expression levels of LPA1 mRNA expression were quantified by real-time RT-PCR. Data were presented as the mean ± SD of LPA1:GAPDH mRNA ratio of three independent experiments (Upper). ∗, P < 0.001, parental cells vs. SiLPA1 transfectant. Lysates of tumor cells were resolved by SDS/PAGE and immunoblotted with an anti-LPA1 polyclonal antibody (Lower). (B) CHOβ3wt cells and stable transfectants (clones Sbl#1 and SiLPA1#6) were assayed for their ability to induce osteolytic bone metastases. Representative radiographs (x-rays) of hind limbs from mice, 21 days after tumor cell inoculation. There was a marked reduction in the extent of osteolytic lesions (arrows) in CHO-SiLPA1#6 cell-bearing mice. Representative bone histology (Histo) of Goldner’s trichrome stained tibial metaphysis from metastatic animals. Bone is stained in green; bone marrow and tumor cells (T) are stained in red. Trabecular bone was almost completely preserved in tibial metaphysis from animals bearing CHO-SiLPA1#6 cells. (C) MDA-BO2/GFP cells and stable transfectants were assayed for their ability to induce bone metastases. Animals were analyzed 30 days after tumor cell injection. Osteolytic lesions were detected by radiography (x-rays), and bone destruction and TB were examined by histology (Histo), as described in B. Fluorescent tumor lesions were identified by fluorescence scanning (Fluo). There was a marked reduction in the extent of osteolytic (arrows) and fluorescent lesions, and trabecular bone was almost completely preserved in tibial metaphysis from animals bearing MDA-BO2/GFP-SiLPA1 cells.
Fig. 2.
Fig. 2.
Effect of LPA1 on tumor cell proliferation in vitro. (A) Total RNA extracts of parental and SKBr-3 cells stably transfected with pCi/HA-LPA1 (clones LPA1#3.1 and #4.1) were subjected to real-time RT-PCR (Upper) and cell lysates were analyzed by Western blotting for LPA1 detection (Lower), as described in Fig. 1A. SKBr-3 cells (B), CHOβ3wt (C), and MDA-BO2/GFP (D) cell proliferation assays. Quiescent tumor cells plated in 96-well tissue culture plates were incubated overnight with 1-oleoyl LPA (0–1 μM) in serum-free medium containing 0.1% (wt/vol) BSA fatty acid-free then pulsed with [H3]thymidine for 8 h. Data of [H3]thymidine incorporation were expressed in cpm, are the mean ± SD of six replicates, and are representative of at least three separate experiments. ∗, P < 0.001, parental cells vs. transfectants.
Fig. 3.
Fig. 3.
Effect of LPA1 on tumor growth and cancer cell proliferation in vivo. (A) Animals were injected s.c. into the flank with parental cells or MDA-BO2/GFP transfectants. Tumor size was assessed by external measurement of the tumors by using a Vernier caliper. Tumor volume was calculated at the indicated time point and expressed as the mean ± SD (in mm3) of 10 animals per group. ∗, P < 0.001, MDA-BO2/GFP cells vs. SiLPA1 clones. (B) s.c. tumor (xenograft) and decalcified metastatic bone tissues (skeletal) were fixed and embedded in paraffin. Six-micrometer tissue sections were subjected to immunohistochemistry by using a monoclonal antibody against the nuclear Ki67 antigen. The mitotic index (numbers are indicated on each image) was calculated as the percentage of nuclei positive for Ki67. Results are expressed as the mean ± SD (in %) of six independent tumor sections with 10 animals per group. #, P < 0.0001, MDA-BO2/GFP tumor-bearing animals vs. transfectant SiLPA1#122 tumor-bearing animals. (Scale bars: 100 μm.)
Fig. 4.
Fig. 4.
Effect of LPA1 expression on tumor cell-mediated osteoclast activity in vitro and in vivo. (A) Mononuclear cells isolated from bone marrow were incubated with mouse M-CSF, RANK-L, and conditioned medium collected from indicated tumor cell lines, treated with 1-oleoyl LPA (1 μM). Differentiated osteoclasts were enumerated under a light microscope as a function of multinucleation (more than three nuclei) and TRAP staining. Results were expressed as the mean ± SD of osteoclast number per mm2. #, P < 0.0001 for conditioned media from MDA-BO2/GFP cells vs. transfectant clone SiLPA1#122, and from SKBr-3 cells vs. transfectant clone HA-LPA1#3.1. (Scale bars: 100 μm.) (B) Representative histological examination of TRAP-stained proximal tibia sections from metastatic animals, 30 days after tumor cell inoculation of parental BO2/GFP cells, mock transfectants (clones Sbl#9), or BO2/GFP-SiLPA1 cells (clones SiLPA1#132) (Left). Bone is stained in dark blue, and osteoclasts are stained in red. (Scale bar: 200 μm.) The percentage of active-osteoclast resorption surface per bone surface (Oc.S/BS) was quantified. Results are expressed as the mean ± SD (in %) of five to eight animals per group. ∗, P < 0.001, BO2/GFP (Cont.), or CHOβ3wt (Cont) vs. SiLPA1 tumor-bearing animals (Right).
Fig. 5.
Fig. 5.
Effect of Ki16425 on LPA-induced tumor cell proliferation. (A) Quiescent BO2/GFP parental cells, scramble and SiLPA1 transfectants, and cells sensitized to the mitogenic action of LPA (MDA-BO2/HA-LPA1 cells) or (B) CHOβ3wt parental cells, scramble, and SiLPA1 transfectants, were treated overnight with increasing concentrations of Ki16425 (0–10 μM) in the presence of 1-oleoyl LPA (0.1 μM). Cell proliferation was monitored as described in Fig. 2B. Data are expressed as the mean ± SD (in cpm) of six replicates and are representative of at least three separate experiments.
Fig. 6.
Fig. 6.
Effect of Ki16425 on the progression of breast cancer bone metastases. Representative radiographs, fluorescence imaging, bone histology, TRAP, and Ki67 staining of hind limbs from metastatic mice treated daily by s.c. injection with PBS (vehicle) or Ki16425. Quantification values, indicated below each image, were the mean ± SD of osteolytic lesion area (x-ray, in mm2), fluorescent lesion area (Fluo, in mm2; ND, not detectable), active-osteoclast resorption surface per bone surface (TRAP, in %), and mitotic index (Ki67, in %) of 10 animals per group. ∗, P < 0.001, vehicle-treated vs. Ki16425-treated animals. Osteolytic lesions are indicated by arrows and TB (T).
Fig. 7.
Fig. 7.
Quantification of circulating Ki16425 in the plasma of metastatic animals and effect of a Ki16425 treatment on platelet aggregation. (A) Quiescent MDA-BO2 cells and cells sensitized to the mitogenic action of LPA (MDA-BO2/HA-LPA1 cells) were incubated overnight with 1-oleoyl LPA (0.1 μM) in serum-free medium in presence of 0.1% (wt/vol) BSA fatty acid–free (Cont.) or with plasma collected from vehicle- or Ki16425-treated animals for 16 days. Cell proliferation was quantified as described in Fig. 2B. Data were expressed as the mean ± SD (in cpm) of six replicates. #, P < 0.0001 plasma-vehicle vs. plasma-Ki16425 for each cell line. (Inset) Standard curve of Ki16425 inhibition on the mitogenic activity of LPA (0.1 μM) for MDA-BO2 and MDA-BO2/HA-LPA1 cells. Arrows indicate the relation between the concentration of Ki16425 and the mitogenic activity of the plasma from Ki16425-treated animals (in cpm). (B) Platelet aggregation experiments were carried out from blood collected from vehicle- and Ki16425-treated animals as described in Methods. Pl, platelets; Col, collagen.

Similar articles

Cited by

References

    1. Mundy G. R. Nat. Rev. Cancer. 2002;2:584–593. - PubMed
    1. Hillner B. E., Ingle J. N., Berenson J. R., Janjan N. A., Albain K. S., Lipton A., Yee G., Biermann J. S., Chlebowski R. T., Pfister D. G. J. Clin. Oncol. 2000;18:1378–1391. - PubMed
    1. Aoki J., Taira A., Takanezawa Y., Kishi Y., Hama K., Kishimoto T., Mizuno K., Saku K., Taguchi R., Arai H. J. Biol. Chem. 2002;277:48737–48744. - PubMed
    1. Boucharaba A., Serre C.-M., Gres S., Saulnier-Blache J. S., Bordet J.-C., Guglielmi J., Clezardin P., Peyruchaud O. J. Clin. Invest. 2004;114:1714–1725. - PMC - PubMed
    1. An S., Dickens M. A., Bleu T., Hallmark O. G., Goetzl E. J. Biochem. Biophys. Res. Commun. 1997;231:619–622. - PubMed

Publication types

MeSH terms

Substances