. 2006 Jul 10;203(7):1643-9.
doi: 10.1084/jem.20052174. Epub 2006 Jun 12.

The clone size of peripheral CD8 T cells is regulated by TCR promiscuity

Affiliations

The clone size of peripheral CD8 T cells is regulated by TCR promiscuity

Yi Hao et al. J Exp Med. .

Abstract

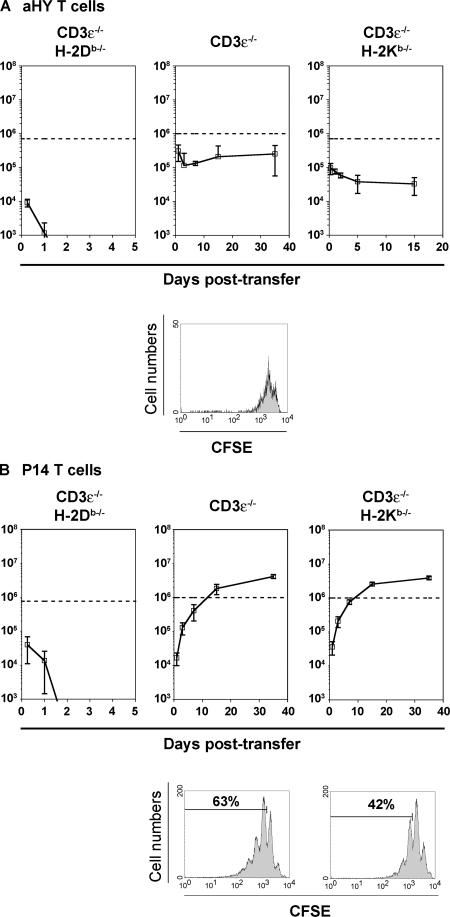
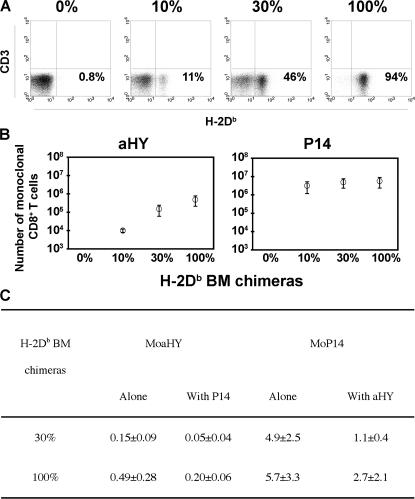
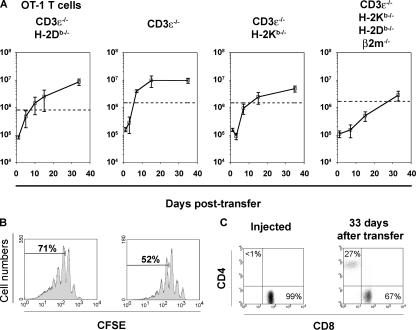
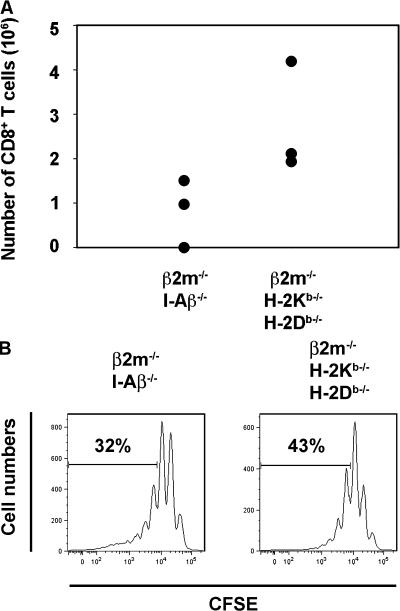
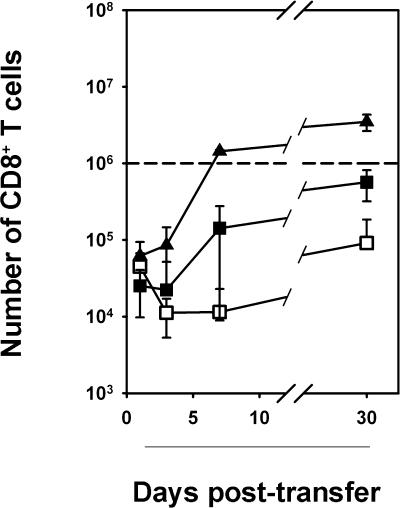
Positive selection in the thymus and peripheral T cell survival depend on T cell receptor (TCR)-major histocompatibility complex (MHC) interactions, but it is not yet clear if both events follow exactly the same rules. We studied peripheral T cell survival and clone sizes in conditions of progressive reduction of restricting MHC-bearing cells or progressive ablation of different MHC molecules. Different CD8(+) T cell clones/polyclonal populations showed different survival and/or lymphopenia-driven proliferation requirements. We could correlate clone sizes to the capacity of each TCR to interact with different types of MHC complexes. Thus, although repertoire selection in the thymus is mainly conditioned by the affinity of TCR-MHC interactions, peripheral selection is determined by TCR cross-reactivity to environmental ligands.


Figures

Figure 1.
Figure 1.
Kinetics of aHY and P14 T cell fate after transfer. (A) Between 0.8 and 1.2 × 10⁶ LN cells from monoclonal aHY mice were transferred into B6.CD3ɛ −/−H-2Db−/− (top left), B6.CD3ɛ −/− (top middle), or B6.CD3ɛ −/−H-2Kb−/− (top right) mice. The bottom panel shows the CFSE dilution patterns 7 d after transfer in B6.CD3ɛ −/− hosts. (B) LN cells from monoclonal P14 mice were transferred into B6.CD3ɛ −/−H-2Db−/− (top left), B6.CD3ɛ −/− (top middle), or B6.CD3ɛ −/−H-2Kb−/− (top right) mice (0.8 and 106, respectively). The bottom panels show the CFSE dilution patterns 7 d after transfer in B6.CD3ɛ −/− (left) and B6.CD3ɛ −/−H-2Kb−/− (right) hosts. The fraction of cells that divided two or more times is shown. The dashed line represents the number of injected cells. Results shown correspond to the number of donor CD8+ T cells recovered from spleen and LN of the three to five host mice (mean ± SD). Similar results were obtained in two to four independent experiments. Long-term recovery of donor cells was studied in sublethally irradiated host mice (450 rads).
Figure 2.
Figure 2.
T cell fate in the presence of reduced amounts of MHC class I–expressing cells. (A) BM chimeras containing limited numbers of H-2Db MHC class I–expressing cells were produced by reconstituting CD3ɛ −/−β2m−/−H-2Db−/−H-2Kb−/− tetra KO mice with mixtures of BM cells from CD3ɛ −/−H-2Db+ (0, 10, 30, and 100%) and CD3ɛ −/−H-2Db−/− mice. Plots show representative proportions of H-2Db+ hematopoietic cells in the BM chimeras of the four experimental groups. (B) 5 wk after reconstitution, 106 LN cells from aHY or P14 mice were transferred into the BM chimeras described in A. Results show the number of donor T cells recovered 4 wk after T cell transfer in five to seven different BM chimeras. Similar results were obtained in three independent experiments. (C) BM chimeras containing either 30 or 100% of H-2Db+ hematopoietic cells received 106 aHY or/and P14 CD8+ T cells injected alone or coinjected. Mice were killed 4 wk later, and the number of aHY and P14 CD8+ T cells was assessed. Values show the mean ± SE of the number (×106) of T cells recovered in the spleen and LNs of four to seven mice. MoaHY, monoclonal aHY; MoP14, monoclonal P14.
Figure 3.
Figure 3.
Kinetics of OT-1 T cell fate after transfer. LN cells from monoclonal OT-1 mice (0.9–1.5 × 10⁶) were transferred into different sublethally irradiated host mice (450 rads). Results shown correspond to the number of donor CD3+CD8+ T cells recovered from spleen and LN of three to five different host mice at different times after transfer (mean ± SD) (when SD bars are not seen they were smaller than the symbol). Similar results were obtained in two to five independent experiments. The dashed line represents the number of injected cells. (A) OT-1 cell fate in CD3ɛ −/−H-2Db−/−, CD3ɛ −/−, CD3ɛ −/−H-2Kb−/− mice and CD3ɛ −/−β2m−/−H-2Db−/−H-2Kb−/− tetra KO mice. (B) CFSE dilution patterns obtained 7 d after transfer in CD3ɛ −/− (left) and CD3ɛ −/−H-2Kb−/− (right) hosts. The fraction of donor cells that divided three or more times is shown. (C) Dot plots show the fractions of gated Tg TCR+ (Vβ5+Vα2+) OT-1 CD4 and CD8 T cells among the injected cells and in the LN of the CD3ɛ −/−β2m−/−H-2Db−/−H-2Kb−/− tetra KO recipient mice 33 d later.
Figure 4.
Figure 4.
Fate of OT-1 cells in MHC class II–deficient mice. (A) About 106 LN OT-1 CD8+ T cells were transferred into sublethally irradiated (450 rads) Rag2−/−γc−/−β2m−/−I-Aβ−/− (left) and CD3ɛ −/−β2m−/−H-2Db−/−H-2Kb−/− tetra KO mice (right). Results show the number of CD8+ donor T cells recovered from spleen and LN of individual host mice 30 d after transfer. Cell recovery was similarly decreased in both spleen and LNs of the I-Aβ−/− mice. (B) The bottom panels show the CFSE dilution 7 d after transfer in B6.I-Aβ−/− (left) CD3ɛ −/−β2m−/−H-2Db−/−H-2Kb−/− (middle) and B6.β2m−/−I-Aβ−/− (right) hosts. The fraction of donor cells that divided three or more times is shown.
Figure 5.
Figure 5.
Polyclonal CD8+ T cell transfers in MHC class I–deficient mice. 106 sorted CD44 (□) and CD44high (▪) CD8+ LN T cells from B6 mice were transferred into sublethally irradiated (450 rads) CD3ɛ −/−β2m−/−H-2Db−/−H-2Kb−/− tetra KO mice. The dashed line represents the number of injected cells. Kinetics of CD8 cell recovery in CD3ɛ −/− MHC class I+ hosts is also shown (▴). Results shown correspond to the number of CD8+ T cells recovered from spleen and LN of the three to six host mice (mean ± SD) at different times after transfer. CD4+ T cells reached a plateau of more than 107 cells in both CD3ɛ −/− and tetra KO mice.

References

    1. Tanchot, C., F.A. Lemonnier, B. Perarnau, A.A. Freitas, and B. Rocha. 1997. Differential requirements for survival and proliferation of CD8 naive or memory T cells. Science. 276:2057–2062. - PubMed
    1. Brocker, T. 1997. Survival of mature CD4 T lymphocytes is dependent on major histocompatibility complex class II–expressing dendritic cells. J. Exp. Med. 186:1223–1232. - PMC - PubMed
    1. Kirberg, J., A. Berns, and H. von Boehmer. 1997. Peripheral T cell survival requires continual ligation of the T cell receptor to major histocompatibility complex-encoded molecules. J. Exp. Med. 186:1269–1275. - PMC - PubMed
    1. Murali-Krishna, K., L.L. Lau, S. Sambhara, F. Lemonnier, J. Altman, and R. Ahmed. 1999. Persistence of memory CD8 T cells in MHC class I-deficient mice. Science. 286:1377–1381. - PubMed
    1. Witherden, D., N. van Oers, C. Waltzinger, A. Weiss, C. Benoist, and D. Mathis. 2000. Tetracycline-controllable selection of CD4(+) T cells: half-life and survival signals in the absence of major histocompatibility complex class II molecules. J. Exp. Med. 191:355–364. - PubMed

Publication types