

Genetic variation in the CCL18-CCL3-CCL4 chemokine gene cluster influences HIV Type 1 transmission and AIDS disease progression
- PMID: 16773571
- PMCID: PMC1474130
- DOI: 10.1086/505331
Genetic variation in the CCL18-CCL3-CCL4 chemokine gene cluster influences HIV Type 1 transmission and AIDS disease progression
Abstract
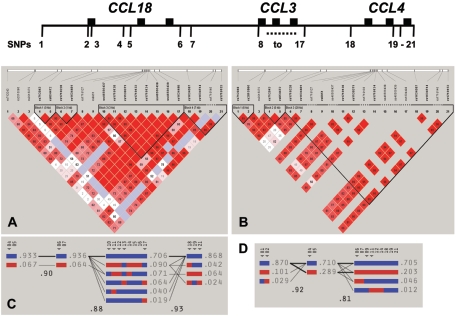
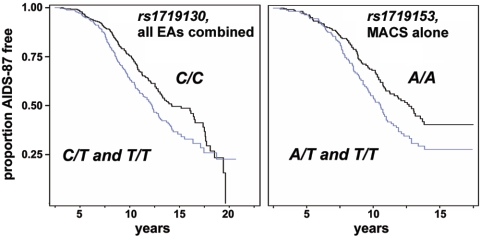
CCL3 (MIP-1 alpha), CCL4 (MIP-1 beta), and CCL18 (DC-CK1/PARC/AMAC-1) are potent chemoattractants produced by macrophages, natural killer cells, fibroblasts, mast cells, CD4(+) T cells, and CD8(+) T cells. CCL3 and CCL4 are natural ligands for the primary human immunodeficiency virus type 1 (HIV-1) coreceptor CCR5 and are also known to activate and enhance the cytotoxicity of natural killer cells. Genomic DNAs from >3,000 participants enrolled in five United States-based natural-history cohorts with acquired immunodeficiency syndrome (AIDS) were genotyped for 21 single-nucleotide polymorphisms (SNPs) in a 47-kb interval on chromosome 17q12 containing the genes CCL3, CCL4, and CCL18. All 21 SNPs were polymorphic in African Americans (AAs), whereas 7 of the 21 had minor-allele frequencies <0.01 in European Americans (EAs). Substantial linkage disequilibrium was observed in a 37-kb interval containing 17 SNPs where many pairwise D' values exceeded 0.70 in both racial groups, but particularly in EAs. Four and three haplotype blocks were observed in AAs and EAs, respectively. Blocks were strongly correlated with each other, and common haplotype diversity within blocks was limited. Two significant associations are reported that replicate an earlier study. First, among AA members of the AIDS Link to the Intravenous Experience cohort of injection drug users, frequencies of three correlated SNPs covering 2,231 bp in CCL3 were significantly elevated among highly exposed, persistently HIV-1-uninfected individuals compared with HIV-1-infected seroconvertors (P = .02-.03). Second, seven highly correlated SNPs spanning 36 kb and containing all three genes were significantly associated with more-rapid disease progression among EAs enrolled in the Multicenter AIDS Cohort Study cohort (P = .01-.02). These results reiterate the importance of chemokine gene variation in HIV-1/AIDS pathogenesis and emphasize that localized linkage disequilibrium makes the identification of causal mutations difficult.
Figures
References
-
- Walker CM, Moody DJ, Stites DP, Levy JA (1986) CD8+ lymphocytes can control HIV infection in vitro by suppressing virus replication. Science 234:1563–1566 - PubMed
-
- Mackewicz C, Levy JA (1992) CD8+ cell anti-HIV activity: nonlytic suppression of virus replication. AIDS Res Hum Retroviruses 8:1039–1050 - PubMed
-
- Cocchi F, DeVico AL, Garzino-Demo A, Arya SK, Gallo RC, Lusso P (1995) Identification of RANTES, MIP-1α, and MIP-1β as the major HIV-suppressive factors produced by CD8+ T cells. Science 270:1811–1815 - PubMed
Publication types
MeSH terms
Substances
Grants and funding
LinkOut - more resources
Full Text Sources
Other Literature Sources
Medical
Research Materials
