. 2006 Sep;17(9):3781-92.
doi: 10.1091/mbc.e06-02-0133. Epub 2006 Jun 14.

The intraflagellar transport protein IFT20 is associated with the Golgi complex and is required for cilia assembly

Affiliations

The intraflagellar transport protein IFT20 is associated with the Golgi complex and is required for cilia assembly

John A Follit et al. Mol Biol Cell. 2006 Sep.

Abstract

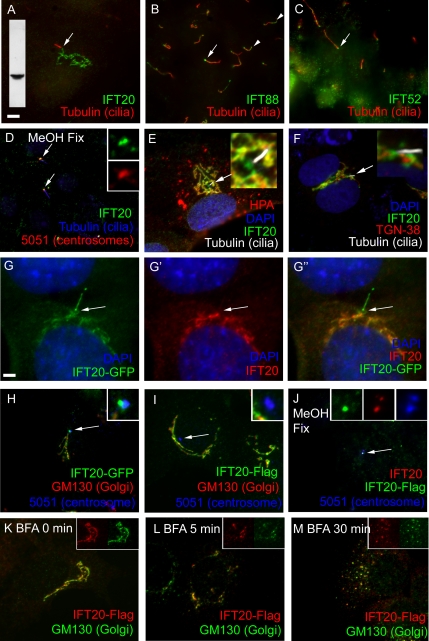
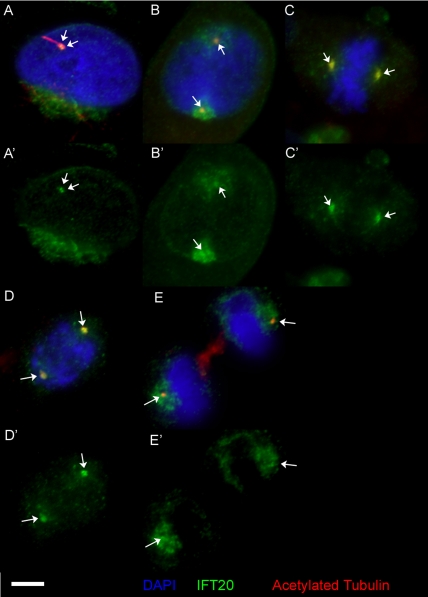
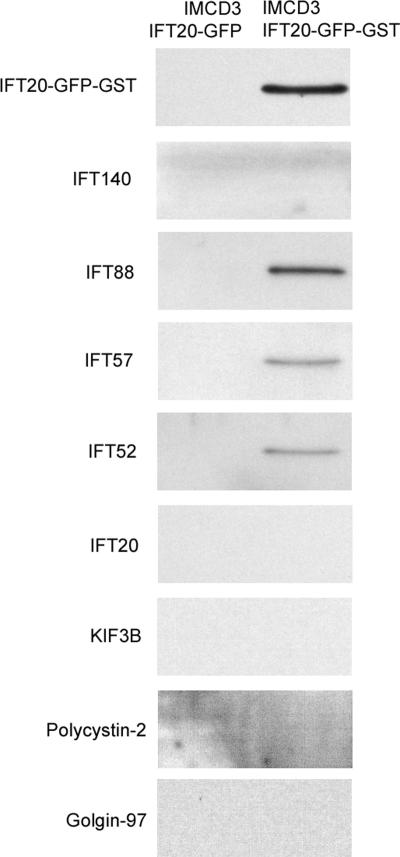
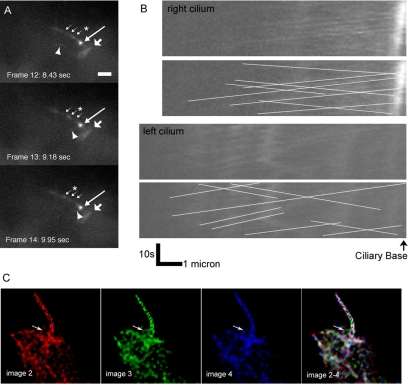
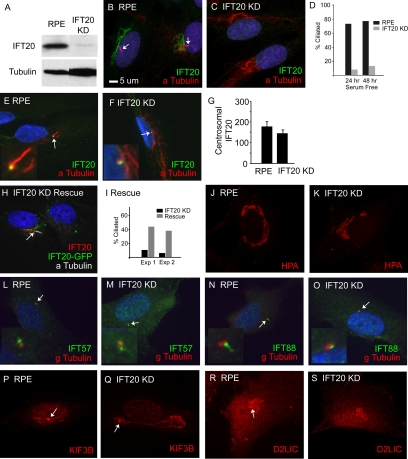
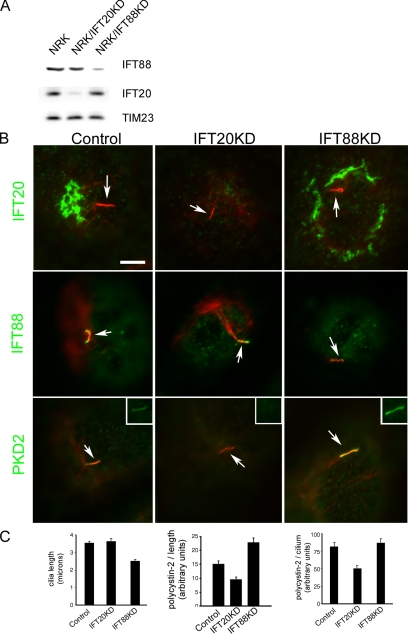
Eukaryotic cilia are assembled via intraflagellar transport (IFT) in which large protein particles are motored along ciliary microtubules. The IFT particles are composed of at least 17 polypeptides that are thought to contain binding sites for various cargos that need to be transported from their site of synthesis in the cell body to the site of assembly in the cilium. We show here that the IFT20 subunit of the particle is localized to the Golgi complex in addition to the basal body and cilia where all previous IFT particle proteins had been found. In living cells, fluorescently tagged IFT20 is highly dynamic and moves between the Golgi complex and the cilium as well as along ciliary microtubules. Strong knock down of IFT20 in mammalian cells blocks ciliary assembly but does not affect Golgi structure. Moderate knockdown does not block cilia assembly but reduces the amount of polycystin-2 that is localized to the cilia. This work suggests that IFT20 functions in the delivery of ciliary membrane proteins from the Golgi complex to the cilium.


Figures

Figure 1.
Figure 1.
Distribution of IFT20 in cells. (A–C) Distribution of IFT particle proteins in mammalian cells. Mouse IMCD3 cells were paraformaldehyde fixed and stained with antibodies to MmIFT20, MmIFT88/polaris, and MmIFT52/ngd5 (green) along with an antibody to acetylated tubulin (red) to mark the position of the primary cilium. Basal body regions are marked with arrows, and distal tips are marked with arrowheads. Inset in A shows a Western blot of IMCD3 protein extract probed with the IFT20 antibody used to label this cell. Size bar is 5 μm and is relevant for all images except G. (D) Mouse IMCD3 cells pre-extracted with Triton X-100, fixed with methanol, and stained with antibodies to IFT20 (green), acetylated tubulin (blue), and autoimmune sera 5051 (red), which labels centrosomes. Insets are 4× enlargements of the green and red channels near the basal body region of the upper cilium. Note that the pre-extraction with Triton X-100 followed by methanol fix removes most of the Golgi-associated IFT20 but reveals the basal body pool. (E) RPE cell stained with anti-IFT20 (green), anti-acetylated tubulin (white), and Helix pomatia agglutinin (red). Note the extensive colocalization of IFT20 and HPA (yellow-orange) and the patch of green at the base of the cilium where HPA is not found. HPA is also found in cytoplasmic vesicles that are not stained with IFT20 antibodies. (F) NRK cells stained with anti-IFT20 and anti-RnTGN-38. Note that this Golgi marker labeled structures very near to IFT20, but there is not extensive overlap. Insets in E and F show 4× enlargements of the regions around the cilia. (G–G″) An IMCD3 cell expressing GFP-tagged IFT20 (G, green) was fixed and stained with an antibody against IFT20 (G′, red). The overlay (G″) shows that the basal body (arrow) and cilia label with GFP but not with IFT20 antibodies, whereas the internal membranes label with both. Size bar, 2.5 μm. (H) IMCD3 cells expressing IFT20-GFP (green) were fixed with paraformaldehyde and stained with the GM130 Golgi marker (red) and the 5051 centrosomal marker (blue). Inset is a 4× enlargement of the centrosome. (I) IMCD3 cells expressing IFT20-Flag (green) were fixed with paraformaldehyde and stained with the GM130 Golgi marker (red) and the 5051 centrosomal marker (blue). Inset is a 4× enlargement of the centrosome. (J) IMCD3 cells expressing IFT20-Flag were pre-extracted with Triton X-100, fixed with methanol, and stained with antibodies to IFT20 (red), Flag (green), and 5051 (centrosomal marker, blue). Inset is a 4× enlargement of the green, red, and blue channels of centrosome. (K–M) IMCD3 cells expressing IFT20-Flag were exposed to brefeldin A for 0, 5, and 30 min, fixed with paraformaldehyde, and stained with antibodies to Flag (red) and GM130 (Golgi, green). Insets are the red and green channels from a portion of the image to illustrate extensive colocalization of the two markers. Similar results were obtained with endogenous IFT20 and IFT20-GFP (unpublished data).
Figure 2.
Figure 2.
IFT20 associates with centrosomes during the cell cycle. (A–E) Actively growing mammalian RPE cells were fixed with methanol and labeled with anti-IFT20 (green, shown alone in A′–E′) and anti-acetylated tubulin (red) antibodies along with DAPI (blue). The position of the centrioles/basal bodies (as determined by 5051 staining, unpublished data) is marked with arrows. Note that a bright focus of IFT20 is associated with the centrosomes at all stages of the cell cycle. Size bar is 5 μm and is relevant for all images.
Figure 3.
Figure 3.
Mammalian IFT20 associates with complex B proteins. Lysates from mouse IMCD3 cells expressing either IFT20-GFP (pJAF2.13) or IFT20-GST-GFP (pJAF25.7) were incubated with glutathione beads and washed, and the bound proteins were eluted with glutathione. The eluted proteins were analyzed by Western blotting with antibodies to the proteins marked on the left side of the images. In this image, IFT20-GFP-GST was detected with the IFT20 antibody and was confirmed with a GFP antibody (unpublished data).
Figure 4.
Figure 4.
IFT20 moves in cell bodies and cilia. (A and B) Time-lapse fluorescence images of cells LLC-PK1 cells expressing IFT20-GFP were taken every 0.75 s for 26 s. These were adjusted for contrast and assembled into a movie that plays at ∼5× normal speed. (A) To illustrate the two types of movements observed, three frames (12–14) are shown. The longest arrow marks the basal body. The broad arrow marks IFT20 in the Golgi complex. The three small arrows mark the position of a particle moving from the basal body to the ciliary tip (anterograde movement). The position of the particle in each frame is marked by an asterisk (*). The arrowhead marks the position of a focus of IFT20-GFP that is moving rapidly in the cytoplasm. In the movie, this focus appears near the basal body, moves out into the cell, and then returns back to the basal body. Size bar, 2 μm long. (B) Kymographs showing IFT20-GFP movement in the two cilia in the movie. The top panel of each pair shows the raw kymographs, whereas lines have been drawn on the bottom panel to mark the moving particles. Anterograde particles show upward sloping lines, whereas retrograde particles show downward sloping lines. (C) Five image Z-stacks were taken of IMCD3 cells expressing IFT20-GFP every 150 ms. The Z-stacks were deconvolved, reduced to a single plane by summing, and assembled into a movie. In C three sequential frames from the movie were pseudocolored red, green, or blue (images 2, 3, and 4), and the three images were combined (images 2–4). The discrete colors in the combined image indicate that the IFT20-GFP is highly dynamic. The arrow in image 3 points to a tubular structure moving into the cilium.
Figure 5.
Figure 5.
Strong IFT20 knockdown blocks ciliary assembly. (A) Western blot of RPE and IFT20 KD cells probed with the IFT20 antibody. The IFT20KD cells were generated by transfection of RPE cells with pGP677.2 followed by dilution cloning to purify a cell line with a strong reduction in the amount of IFT20. Western blot with an anti-tubulin antibody as a loading control shows that more protein was loaded from the knockdown cells than the control cells. (B and C) RPE and IFT20KD cells labeled with anti-MmIFT20 (green), anti-acetylated tubulin (red), and DAPI (blue). Cilia are marked with arrows. Note the absence of IFT20 staining and lack of cilia in C. (D) The IFT20KD cells are less ciliated than control cells. Percent ciliation was determined by counting the number of cilia found on 100 cells that had been stained with anti-acetylated tubulin antibodies. (E and F) RPE and IFT20KD cells were pre-extracted with Triton X-100, methanol fixed, and then stained with antibodies to IFT20 (green), acetylated tubulin (red), and DAPI (blue). Note that IFT20 remains at the centriole/basal body (arrows) in both cell lines. Insets are 4× enlargements of the basal body regions. (G) The amount of IFT20 remaining at the centrosome was quantified on 25 cells from each population. Error bars, SEM. (H and I) Knockdown cells were electroporated with a construct that expresses mouse IFT20 tagged with GFP. This restores cilia assembly (arrow in H, graph in I). The percent of ciliated cells were determined after two separate transfections (Exp 1 and Exp 2). (J and K) RPE and IFT20KD cells stained with HPA, a lectin that labels the cis and medial cisternae of the Golgi complex. Note that the Golgi structure appears normal in the knockdown cells. (L–O) RPE and IFT20KD cells stained with anti-IFT57 (green; L and M) and anti-IFT88 (green; N and O), along with DAPI (blue) and anti-gamma tubulin (red). Insets are 4× enlargements of the basal body regions. Note that a spot of IFT57 or IFT88 is found near one of the two centrioles in both control and knockdown cells. (P–S) RPE and IFT20KD cells stained with anti-KIF3B (P and Q) and anti D2LIC (R and S). Note that the Golgi staining appears similar in knockdown and control cells. Basal bodies are marked with arrows. Size bar in B is 5 μm and applies to all images.
Figure 6.
Figure 6.
Moderate IFT20 knockdown reduces ciliary polycystin-2 levels. Rat kidney NRK cells lines with reduced IFT20 or IFT88 were generated by expression of shRNA constructs. (A) Western blot analysis showing the reduction of IFT20 and IFT88 in the two cell lines. TIM23 was used as a loading control. (B) Immunofluorescence images showing that cilia (arrows) are still formed in these cells (acetylated tubulin, red). IFT20 (top row) and IFT88 (middle row) are reduced in the respective knockdown line but not greatly altered in the reciprocal line. Ciliary polycystin-2 (PKD2, green) is reduced in the IFT20 knockdown line (bottom middle) compared with the control cells (bottom left) and the IFT88 knockdown line (bottom right). The insets in the bottom row show ciliary polycystin-2 staining without acetylated tubulin staining. (C) Bar graphs show average (n = 50 per condition) ciliary length, polycystin-2 per unit length, and polycystin-2 per cilium. To obtain polycystin-2 per unit length, the amount of polycystin-2 in each cilium was divided by its length. Error bars, SEM.

References

    1. Allan V. J., Thompson H. M., McNiven M. A. Motoring around the Golgi. Nat. Cell Biol. 2002;4:E236–E242. - PubMed
    1. Baker S. A., Freeman K., Luby-Phelps K., Pazour G. J., Besharse J. C. IFT20 links kinesin II with a mammalian intraflagellar transport complex that is conserved in motile flagella and sensory cilia. J. Biol. Chem. 2003;278:34211–34218. - PubMed
    1. Bloodgood R. A. Ciliary and Flagellar Membranes. New York: Plenum Press; 1990.
    1. Bouck G. B. The structure, origin, isolation and composition of the tubular mastigonemes of the Ochromonas flagellum. J. Cell Biol. 1971;50:362–384. - PMC - PubMed
    1. Brailov I., Bancila M., Brisorgueil M., Miquel M., Hamon M., Verge D. Localization of 5-HT(6) receptors at the plasma membrane of neuronal cilia in the rat brain. Brain Res. 2000;872:271–275. - PubMed

Publication types