Comparative Study
. 2006 Jun 14;26(24):6485-95.
doi: 10.1523/JNEUROSCI.5061-05.2006.

Receptive field (RF) properties of the macaque second somatosensory cortex: RF size, shape, and somatotopic organization

Affiliations
Comparative Study

Receptive field (RF) properties of the macaque second somatosensory cortex: RF size, shape, and somatotopic organization

Paul J Fitzgerald et al. J Neurosci. .

Abstract

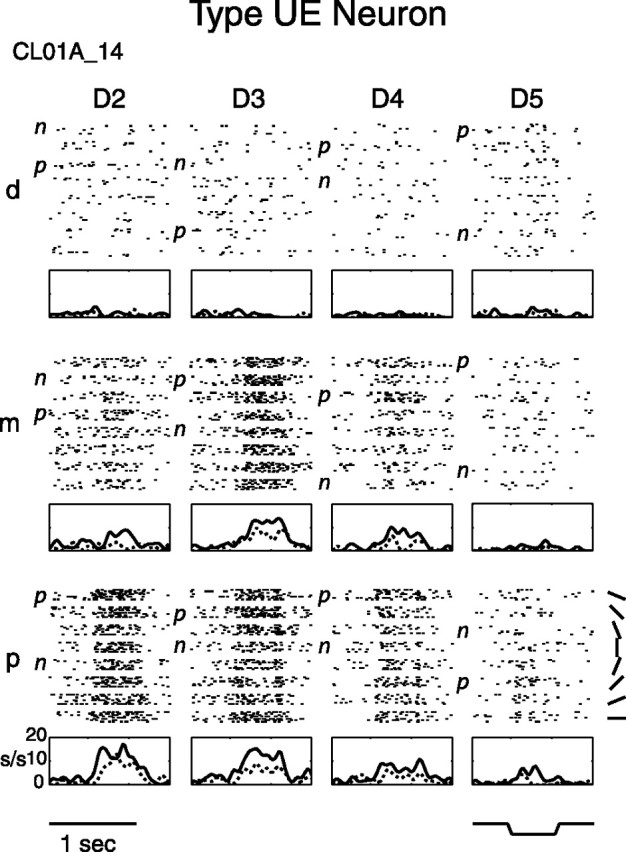
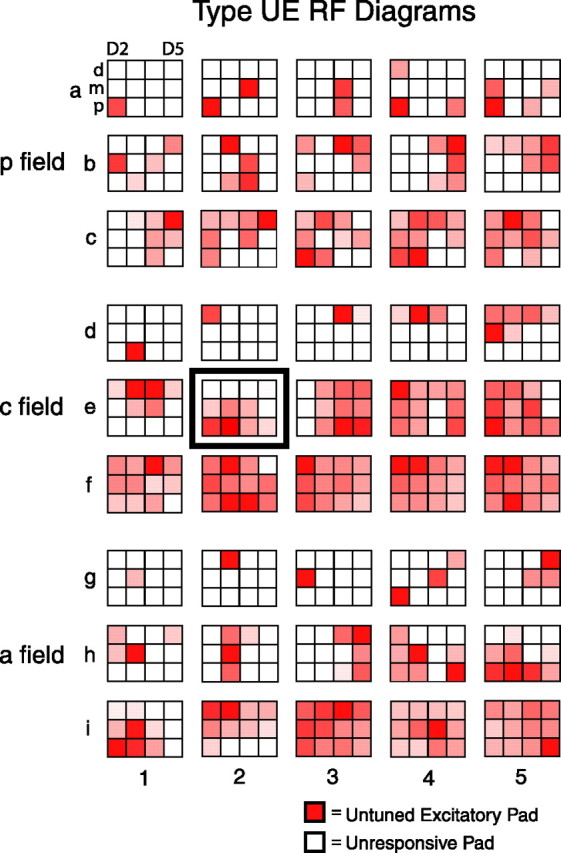
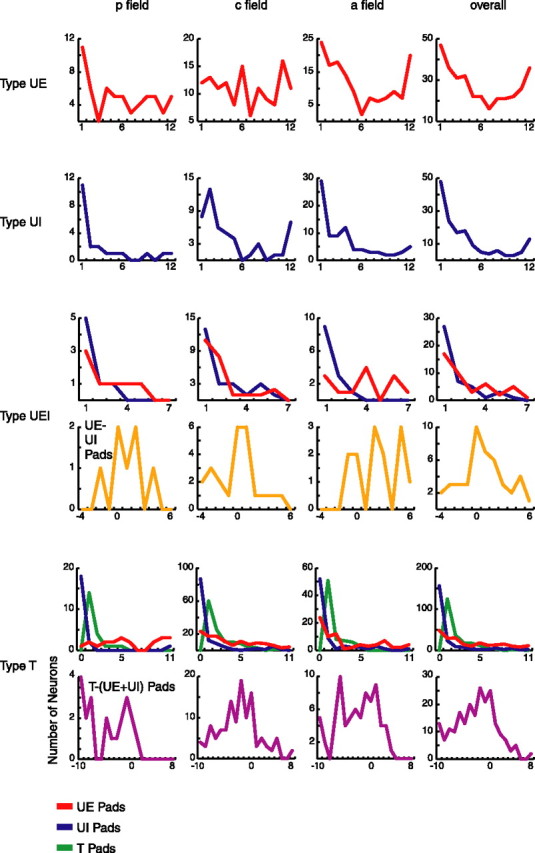
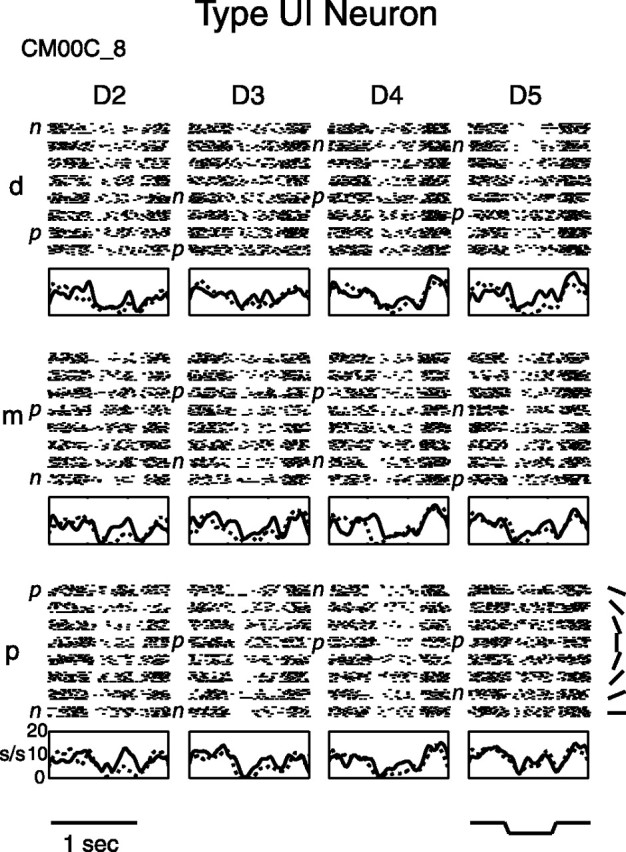
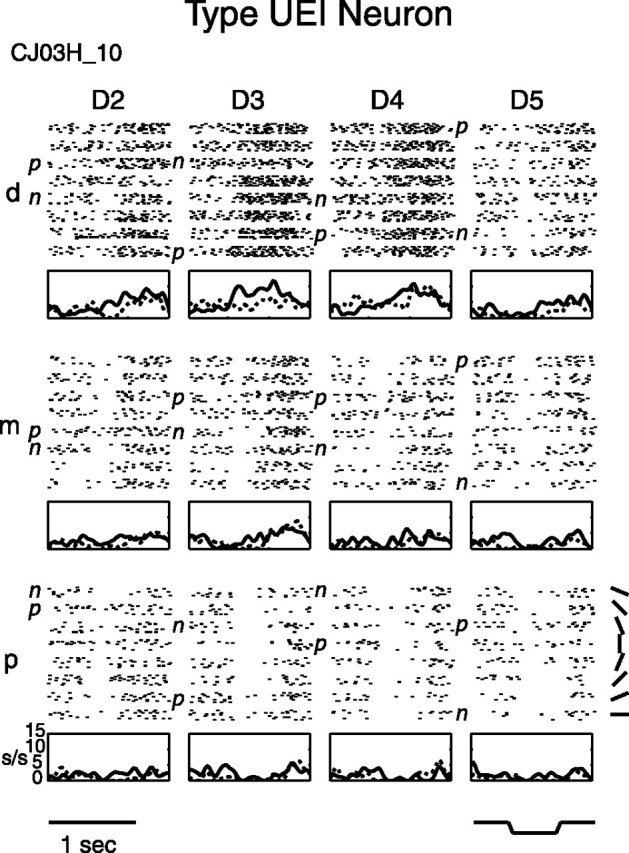
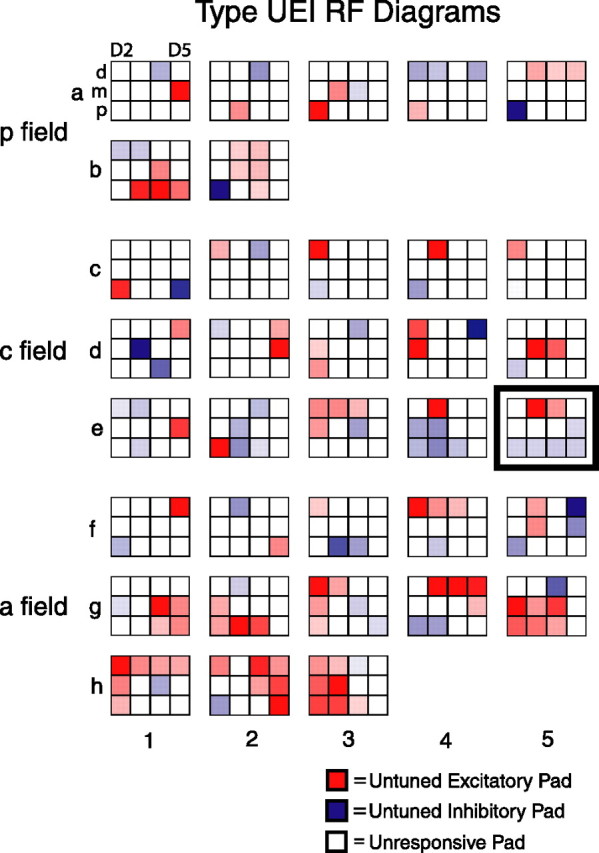
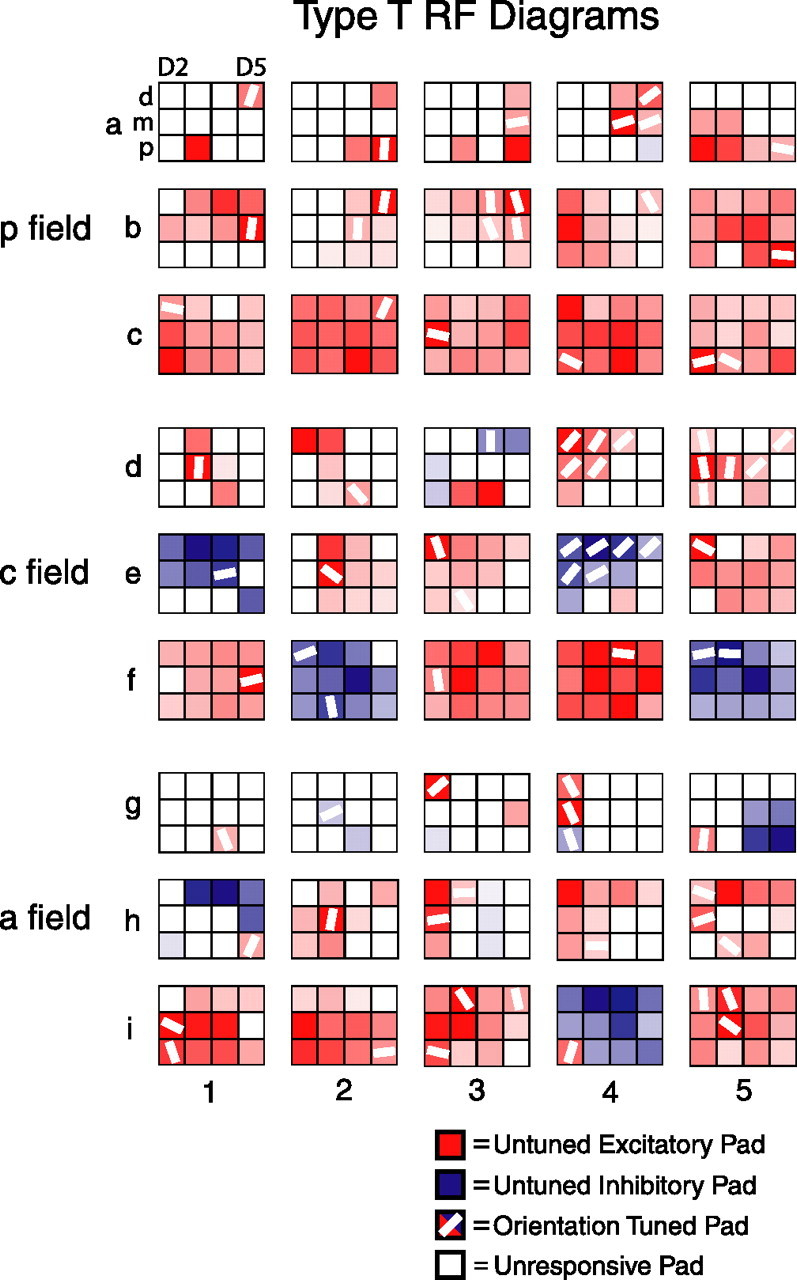
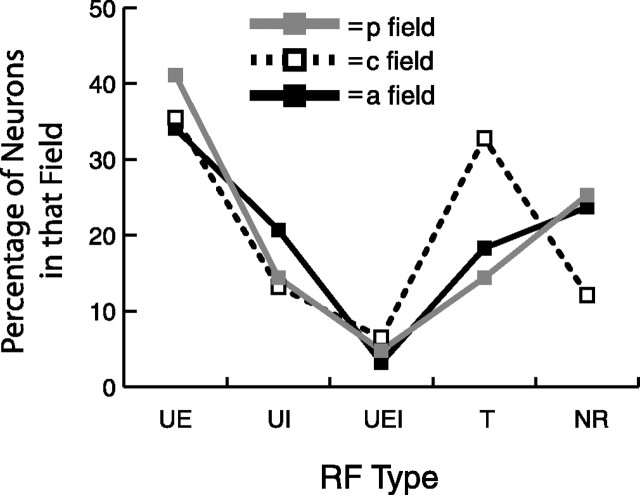
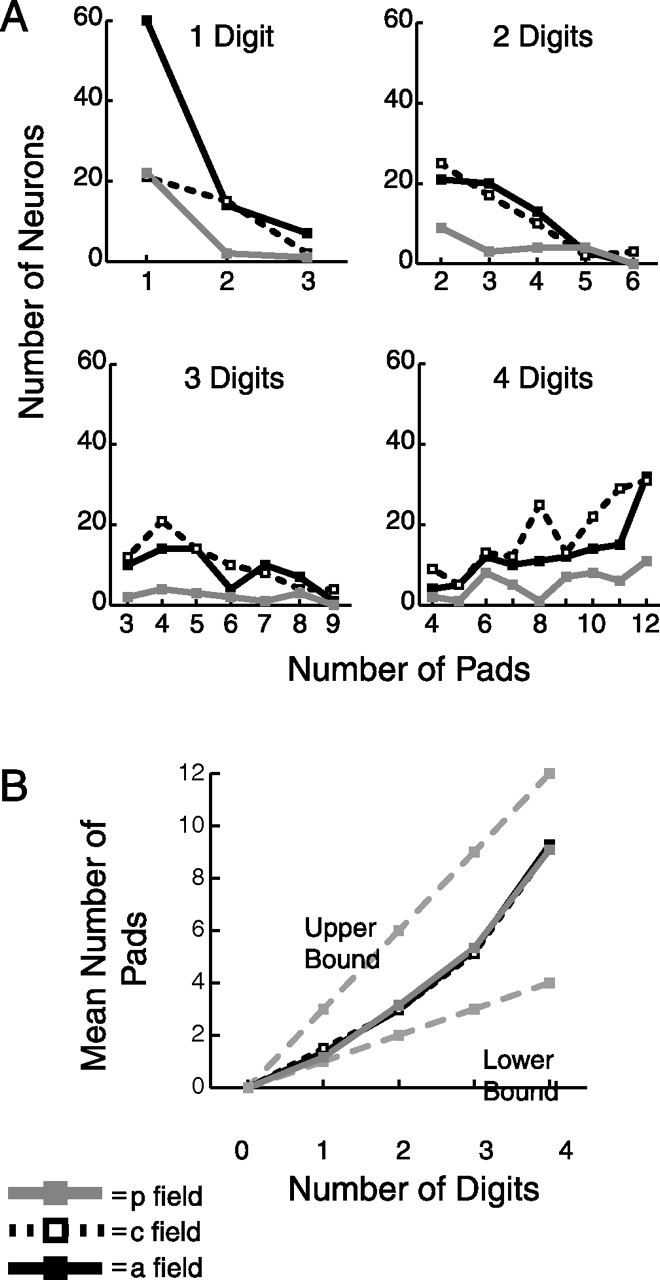
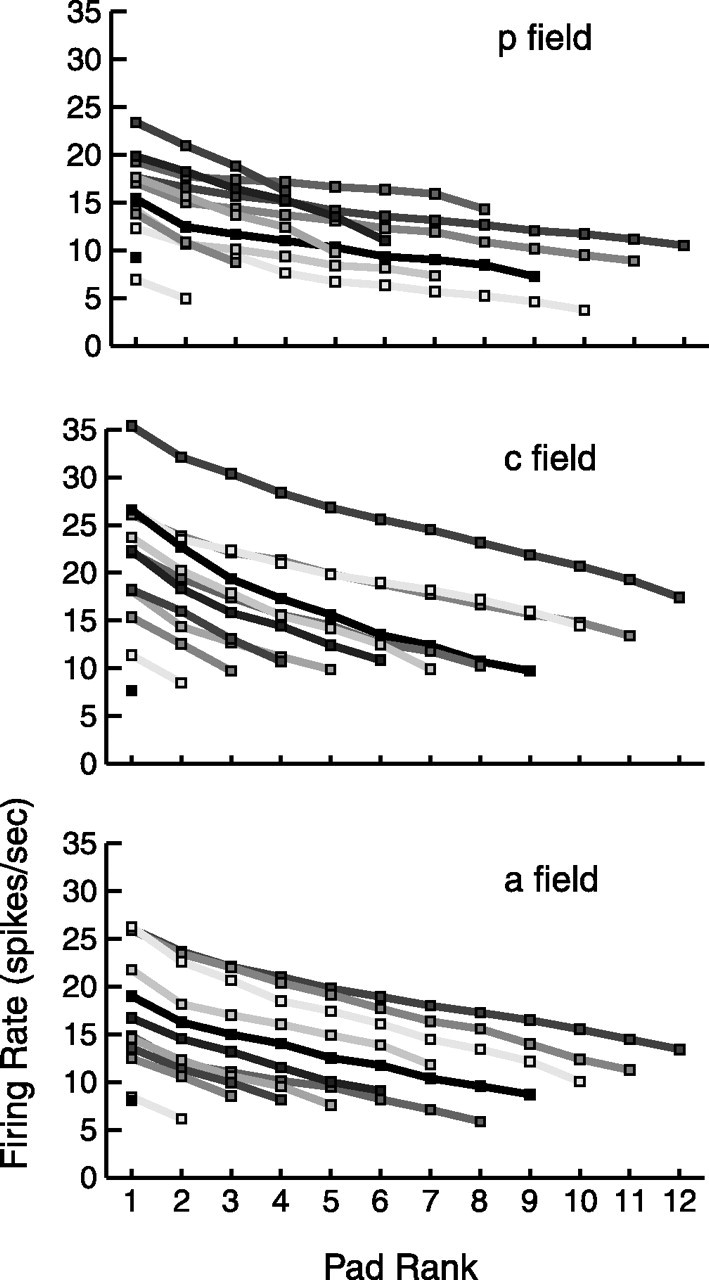
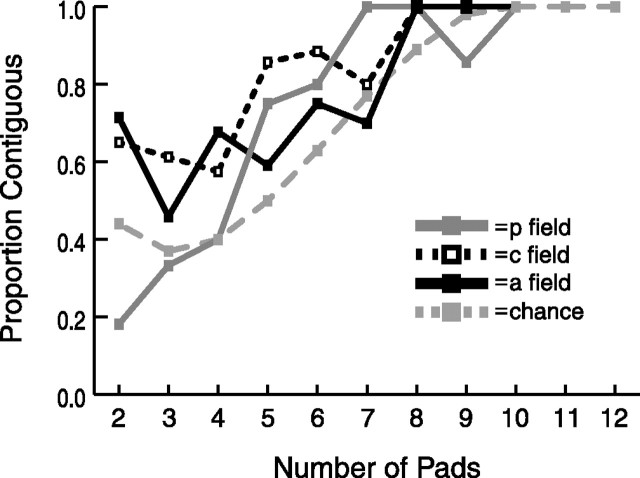
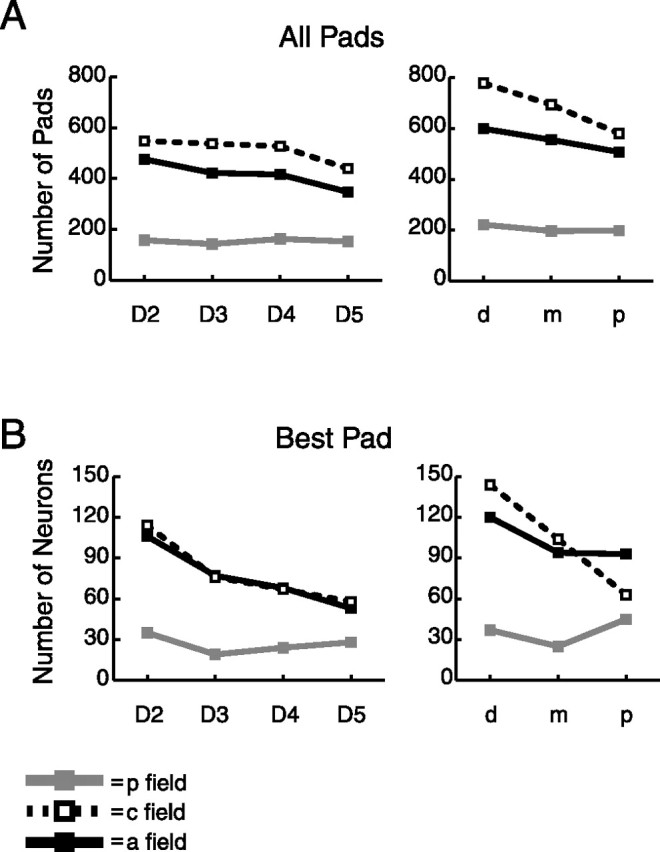
The detailed structure of multidigit receptive fields (RFs) in somatosensory cortical areas such as the SII region has not been investigated previously using systematically controlled stimuli. Recently (Fitzgerald et al., 2004), we showed that the SII region comprises three adjoining fields: posterior, central, and anterior. Here we characterize the RF structures of the 928 neurons that were reported in that study using a motorized oriented bar that was indented into the 12 finger pads of digits 2-5. Most (81%) of the neurons were responsive to the oriented bar stimuli, and 81% of those neurons had RFs that spanned multiple digits. Furthermore, the RFs varied greatly in size, shape, and complexity. Some RFs contained only excitatory finger pads, some contained only inhibitory pads, and some contained both types of pads. A subset of the neurons (23%) showed orientation tuning within one or more pads. The RFs spread across different digits more than within individual digits, and the responsive finger pads for a given neuron tended to cluster together within the hand. Distal and lateral finger pads were better represented than proximal and medial finger pads. Furthermore, neurons in the posterior, central, and anterior SII region fields contained different proportions of RF types. These results collectively indicate that most SII region neurons are selective for different stimulus forms either within single finger pads or across multiple pads. We hypothesize that these RFs represent the kernels underlying the representation of tactile shape.


Figures

Figure 1.
Figure 1.
Type UE neuron raster and PSTH. Type UE neurons had only untuned excitatory finger pads. In the raster, stimulus trials are first sorted into the 12 stimulated finger pads (D2–D5, d–p) and then within each pad are sorted by the orientation of the bar (see bottom right). The bar stimulus indentation profile is also shown (bottom right). Each PSTH graph is shown below its corresponding finger pad, in which only the preferred (highest firing rate; solid line) and nonpreferred (lowest firing rate; dashed line) orientation rates are plotted after convolving these rates with a Gaussian (raw bin size before smoothing was 25 ms; Gaussian ς is 35.4 ms). Shown is central field neuron CL01A_14. D, Digit; d, distal; m, middle; p, proximal; p, preferred orientation; n, nonpreferred orientation; s/s, spikes per second.
Figure 2.
Figure 2.
Type UE receptive fields. Shown are receptive field diagrams of a random sampling of 15 posterior field, 15 central field, and 15 anterior field type UE neurons. a–c represent posterior field neurons, d–f represent central field neurons, and g–i represent anterior field neurons. Each 3 × 4 grid represents the 12 pads of D2–D5 for a single neuron (as shown for the top left receptive field diagram), with the top row of each grid representing the distal pads and the left column representing D2 (in which left-hand and right-hand receptive fields are interspersed, and right-hand receptive fields are reflected leftward). Each white square is an unresponsive pad, whereas each red square is an untuned excitatory pad. The degree of redness of each untuned excitatory pad is normalized to the maximum deviation from the spontaneous firing rate of the 96 pad/orientation stimulus combinations and represents the peak excitatory rate (preferred orientation) of each untuned excitatory pad. Within each SII region field, the neurons are arranged in ascending order based on RF size (number of pads). The receptive field diagram for type UE neuron CL01A_14 (Fig. 1) is framed and shown in position e2.
Figure 3.
Figure 3.
Receptive field size. Shown are receptive field sizes based on the number of neurons with the given number of responsive finger pads for each of the four responsive neuron types (UE, UI, UEI, and T). For type UE neurons, the number of UE pads (red) per neuron is shown. For type UI neurons, the number of UI pads (blue) is shown. For type UEI neurons, the number of UE and UI pads are shown independently, as well as the number of UE pads minus the number of UI pads (orange). For type T neurons, the number of UE, UI, and T pads (green) are shown independently, as well as the number of T pads minus the sum of UE and UI pads (purple). The overall distribution represents the total number of neurons of the given type from all three fields.
Figure 4.
Figure 4.
Type UI neuron raster and PSTH. Type UI neurons had only untuned inhibitory finger pads. Raster and PSTH graphs are arranged as in Figure 1, with the same abbreviations. Shown is posterior field neuron CM00C_8.
Figure 5.
Figure 5.
Type UI receptive fields. For more details, see the legend of Figure 2. Each blue square is an untuned inhibitory pad. The degree of blueness of each untuned inhibitory pad is normalized to the maximum deviation from the spontaneous firing rate of the 96 pad/orientation stimulus combinations and represents the peak inhibitory rate (nonpreferred orientation) of each untuned inhibitory pad. The receptive field diagram for type UI neuron CM00C_8 (Fig. 4) is framed and shown in position c5.
Figure 6.
Figure 6.
Type UEI neuron raster and PSTH. Type UEI neurons had both untuned excitatory and untuned inhibitory finger pads. Raster and PSTH graphs are arranged as in Figure 1, with the same abbreviations. Shown is central field type UEI neuron CJ03H_10.
Figure 7.
Figure 7.
Type UEI receptive fields. Shown are receptive field diagrams of 35 type UEI neurons, including all seven such posterior field neurons, a random sampling of 15 such central field neurons, and all 13 such anterior field neurons. a and b represent posterior field neurons, c–e represent central field neurons, and f–h represent anterior field neurons. For more details, see Figure 2. The receptive field diagram for type UEI neuron CJ03H_10 (Fig. 6) is framed and shown in position e5.
Figure 8.
Figure 8.
Type T receptive fields. Type T neurons had one or more orientation tuned finger pads, and most had additional untuned pads. For more details, see Figure 2. Each red or blue square with a superimposed white bar is an orientation tuned pad. The degree of redness or blueness of each colored pad is normalized to the maximum deviation from the spontaneous firing rate of the 96 pad/orientation stimulus combinations. For untuned excitatory pads, redness represents the peak excitatory rate (preferred orientation); for untuned inhibitory pads, blueness represents the peak inhibitory rate (nonpreferred orientation); and for tuned pads, redness or blueness represents the maximum deviation from the spontaneous rate. The orientation of each white bar represents the preferred orientation (mean angular vector) of that tuned pad. As in Figures 2, 5, and 7, both right-hand and left-hand receptive fields are plotted with D2 in the left column of each 3 × 4 grid, although the preferred orientations of tuned pads are not reflected.
Figure 9.
Figure 9.
Receptive field types. Shown are the percentages of the five receptive field types (UE, UI, UEI, T, and NR) within each field.
Figure 10.
Figure 10.
Number of responsive pads versus digits, per neuron. A, Number of responsive pads per responsive digit for each neuron. A pad was defined as responsive if it was untuned excitatory, untuned inhibitory, or orientation tuned (see Materials and Methods). A digit was defined as responsive if it contained one or more responsive pads. So every one-digit neuron could have one to three responsive pads, every two-digit neuron could have two to six responsive pads, every three-digit neuron could have three to nine responsive pads, and every four-digit neuron could have 4–12 responsive pads. B, Mean number of responsive pads per responsive digit for each neuron. The upper and lower bounds indicate the maximum and minimum number of pads per digit, respectively.
Figure 11.
Figure 11.
Falloff in responsiveness. Each curve represents the mean decrease in peak firing rate (preferred orientation rate) across pads for neurons with n responsive pads (in which rate is averaged across all neurons with the given number of responsive pads in the given SII region field). n is between 1 and 12, and pads are rank ordered from highest firing rate (left) to lowest firing rate (right).
Figure 12.
Figure 12.
Contiguity. A receptive field is defined as contiguous if all of its responsive pads are interconnected (within the 3 × 4 grid of stimulated pads) such that no pad or group of pads is separated from the remaining group or groups by spatially intervening unresponsive pads. Therefore, contiguity is only relevant for neurons with two or more responsive pads. Diagonally bordering pads are considered contiguous. Chance (gray dashed line) was calculated with separate simulations based on a random distribution of n = 2–12 responsive pads throughout the 12 stimulated pads.
Figure 13.
Figure 13.
Somatotopic representation of the digits. A, Representation of digits and pads for all responsive pads. B, Representation of digits and pads for the best pad of each responsive neuron. Best pad is defined as the responsive pad with highest firing rate at its preferred orientation.

References

    1. Burton H, Sinclair RJ (1991). Second somatosensory cortical area in macaque monkeys. 2. Neuronal responses to punctate vibrotactile stimulation of glabrous skin on the hand. Brain Res 538:127–135. - PubMed
    1. Burton H, Fabri M, Alloway K (1995). Cortical areas within the lateral sulcus connected to cutaneous representations in areas 3b and 1: a revised interpretation of the second somatosensory area in macaque monkeys. J Comp Neurol 355:539–562. - PubMed
    1. Burton H, Sinclair RJ, Hong SY, Pruett JR, Whang KC (1997). Tactile-spatial and cross-modal attention effects in the second somatosensory and 7b cortical areas of rhesus monkeys. Somatosens Mot Res 14:237–267. - PubMed
    1. Chapman CE, Meftah EM (2005). Independent controls of attentional influences in primary and secondary somatosensory cortex. J Neurophysiol 94:4094–4107. - PubMed
    1. Chapman CE, Ageranioti-Belanger SA (1991). Discharge properties of neurons in the hand area of primary somatosensory cortex in monkeys in relation to the performance of an active tactile discrimination task. Exp Brain Res 87:319–339. - PubMed

Publication types