. 2006 Jul;80(13):6575-87.
doi: 10.1128/JVI.00347-06.

Simian virus 40 late proteins possess lytic properties that render them capable of permeabilizing cellular membranes

Affiliations

Simian virus 40 late proteins possess lytic properties that render them capable of permeabilizing cellular membranes

Robert Daniels et al. J Virol. 2006 Jul.

Abstract

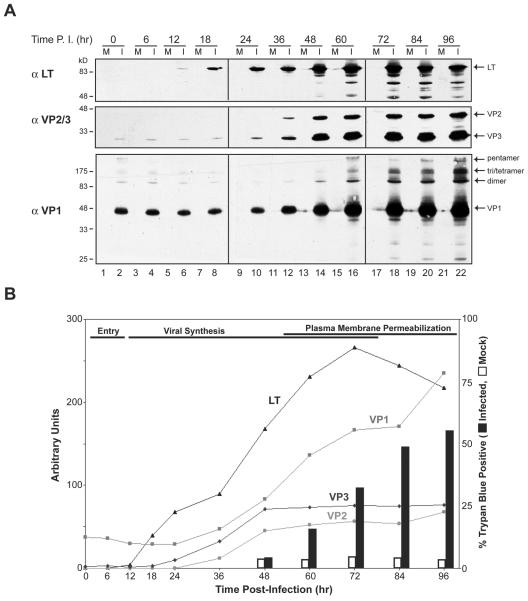
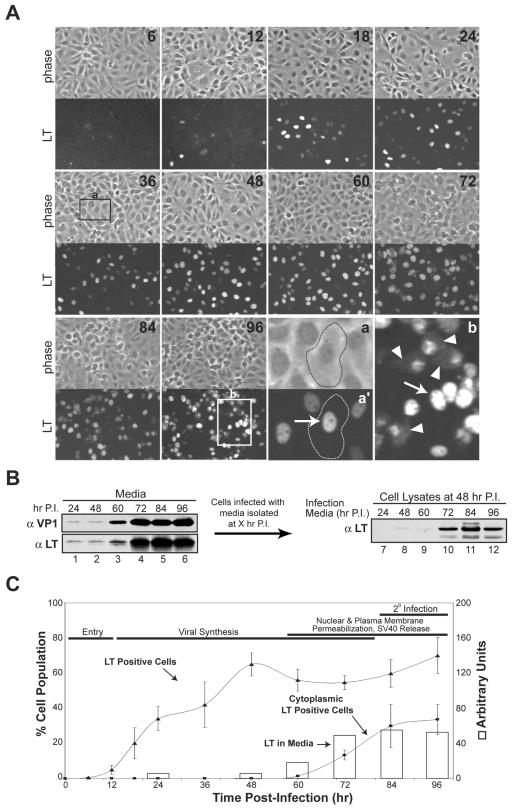
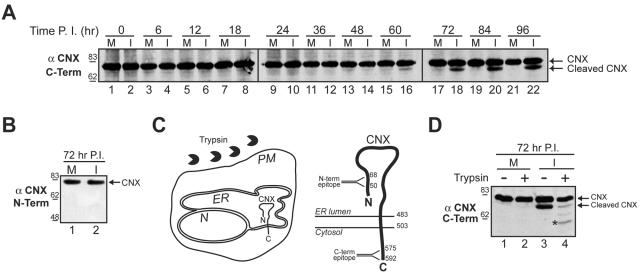
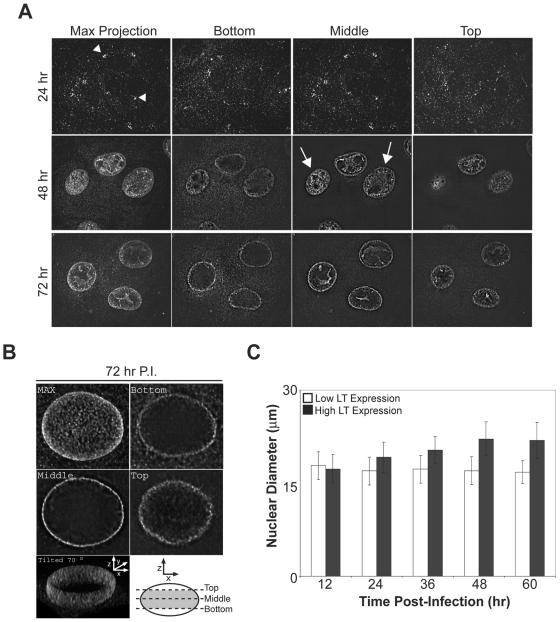
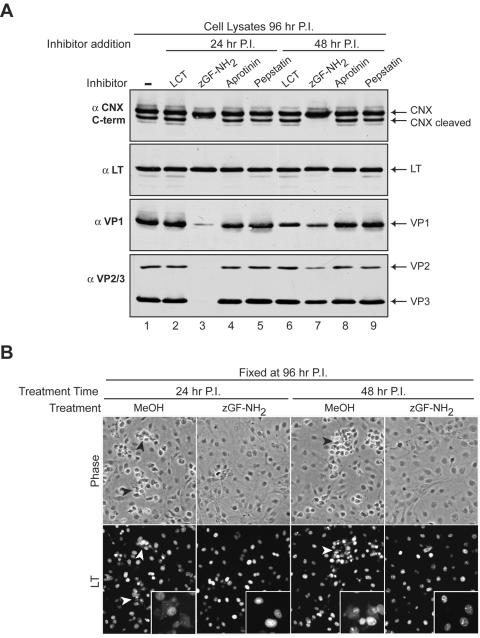
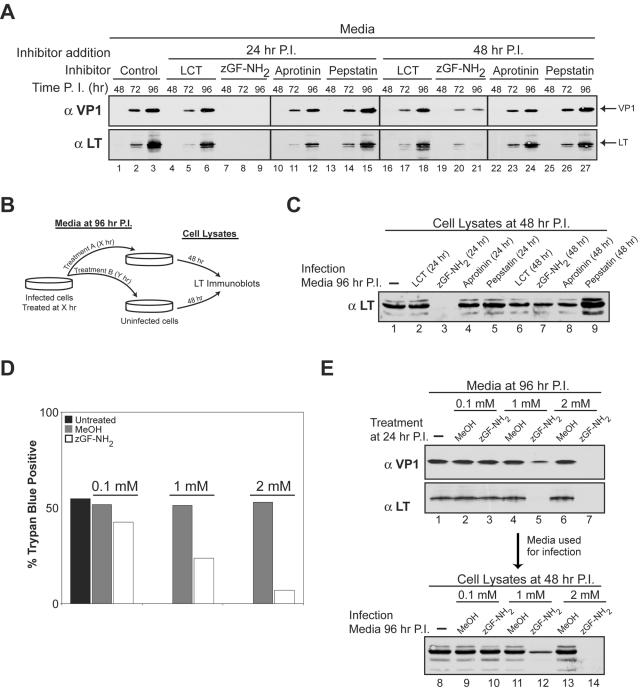
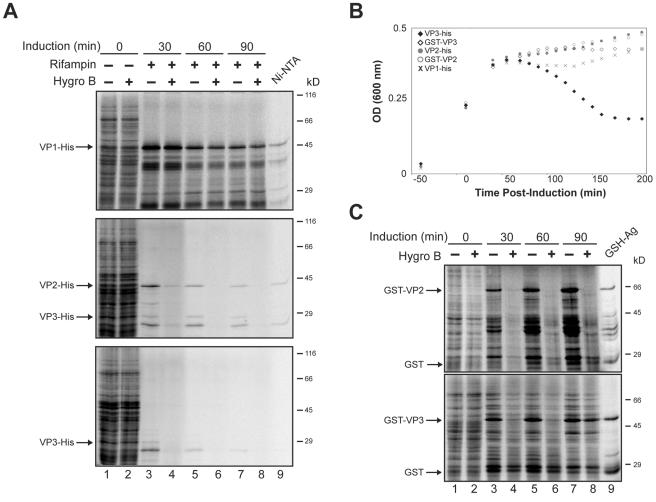
Many nonenveloped viruses have evolved an infectious cycle that culminates in the lysis or permeabilization of the host to enable viral release. How these viruses initiate the lytic event is largely unknown. Here, we demonstrated that the simian virus 40 progeny accumulated at the nuclear envelope prior to the permeabilization of the nuclear, endoplasmic reticulum, and plasma membranes at a time which corresponded with the release of the progeny. The permeabilization of these cellular membranes temporally correlated with late protein expression and was not observed upon the inhibition of their synthesis. To address whether one or more of the late proteins possessed an inherent capacity to induce membrane permeabilization, we examined the permeability of Escherichia coli that separately expressed the late proteins. VP2 and VP3, but not VP1, caused the permeabilization of bacterial membranes. Additionally, VP3 expression resulted in bacterial cell lysis. These findings demonstrate that VP3 possesses an inherent lytic property that is independent of eukaryotic signaling or cell death pathways.


Figures

FIG. 1.
FIG. 1.
Temporal analysis of early and late SV40 viral-protein expression and plasma membrane permeabilization after infection. (A) Protein lysates from SV40-infected BS-C-1 cells were immunoblotted with antisera to large T antigen (αLT), VP1 (αVP1), and VP2 and VP3 (αVP2/3). SV40 was bound to confluent monolayers of BS-C-1 cells for 2 h at 4°C, after which the infection medium was removed and replaced with growth medium. Mock (M) and SV40-infected (I) cells were harvested at the indicated times after 4°C binding. Note that VP1 and VP3 were observed from 0 to 24 h postinfection due to their detection from the incoming particles. P.I., postinfection. (B) Quantification of the immunoblots from panel A (lines) and the trypan blue staining of ∼1,000 cells that were mock or SV40 infected.
FIG. 2.
FIG. 2.
Large T antigen exits the nucleus and accumulates extracellularly during host cell permeabilization. (A) Confocal microscopy showing the location and population of LT in SV40-infected BS-C-1 cells over time. Coverslips containing confluent BS-C-1 cells were infected as in Fig. 1A, fixed at the indicated time points post-4°C binding with cold 100% MeOH, and immunostained for LT. Representative images showing LT immunofluorescent staining of the corresponding confluent fields (phase contrast) at the indicated times postinfection are displayed. The phase-contrast image in “a” shows the outline of a normal infected cell at 36 h, positive for LT in the nucleus (a', arrow); “b” shows both permeabilized cells from 96 h with LT in the cytoplasm (arrowheads) and normal nuclear localization (arrow). (B) Immunoblots of the culture media collected at the indicated times postinfection (lanes 1 to 6) and cell lysates harvested at 48 h postinfection with the isolated medium samples (lanes 7 to 12). BS-C-1 cells were infected as in Fig. 1A, the medium was collected at the indicated times, cellular debris was sedimented at 20,000 × g, and ∼5% of the supernatant was resolved and probed with antisera to LT (αLT) and VP1 (αVP1) (lanes 1 to 6). To test for the presence of infectious particles, BS-C-1 cells were infected with 2% of the supernatant analyzed in lanes 1 to 6, and the cells were washed and harvested by trypsinization at 48 h prior to immunoblotting for the presence of LT (lanes 7 to 12). P.I., postinfection. (C) Quantification of the LT-positive cells and the cells with cytoplasmic LT localization (lines) from panel A and the immunoblots of LT in the culture media from panel B, lanes 1 to 6 (open bars). Fields totaling ∼5,000 cells were counted for each time point to calculate the LT percentage shown on the left y axis.
FIG. 3.
FIG. 3.
The ER is ruptured in SV40-infected cells. (A) Cleavage of the ER-resident membrane protein calnexin was monitored by immunoblotting with an antibody to the C terminus of calnexin (αCNX C-term). Confluent BS-C-1 cells were mock (M) or SV40 infected (I) and harvested as in Fig. 1A. (B) Immunoblots of the samples shown in panel A at 72 h postinfection (see lanes 17 and 18) were probed with an antibody to the N terminus of calnexin (αCNX N-term). (C) Diagram of the assay used in panel D showing the addition of trypsin to a cell with respect to the orientation of calnexin within the ER membrane. The larger schematic shows a more detailed topology map of calnexin in the ER membrane, depicting the location of the epitopes for the C- and N-terminal antibodies within the cytosolic and ER-luminal domains, respectively. N, nucleus; PM, plasma membrane; CNX, calnexin. Numbers indicate amino acid residues. (D) Mock (M) or SV40 infected (I) cells at 72 h were treated with trypsin for 15 min where indicated. The cell lysates were separated by SDS-PAGE and probed with the antibody to the C terminus of calnexin. The asterisk indicates a partially trypsinized form of calnexin. Number scale at left in panels A, B, and D indicates molecular mass in kilodaltons. P.I., postinfection.
FIG. 4.
FIG. 4.
SV40 egresses to the nuclear envelope after the expansion of the nucleus due to the accumulation of progeny virions. (A) Representative fluorescent images of SV40-infected BS-C-1 cells, fixed at the indicated times postinfection, immunostained for VP1, and examined by confocal microscopy. Serial z sections were compiled to produce the “Max Projection” while individual z sections from the bottom, middle, and top of the cells are displayed for samples at 48 and 72 h postinfection. The arrowheads indicate the perinuclear accumulation of incoming SV40 and the arrows designate cells with newly synthesized VP1 throughout the nucleus. (B) z sections of an infected cell at 72 h postinfection were collected, deconvolved, and reconstructed into a three-dimensional volume. The compilation of the z sections is shown in “MAX” and single z sections taken according to the diagram from the bottom, middle, and top of the cell are displayed. The two-dimensional projection of the reconstructed three-dimensional volume of the diagrammed section (gray area) was tilted 70° to display the inside of the nucleus. P.I., postinfection. (C) The nuclear diameter of SV40-infected BS-C-1 cells over time with high and low LT expression. Confluent BS-C-1 coverslips were infected as in Fig. 1A, fixed at the indicated time, and immunostained for LT to identify infected cells.
FIG. 5.
FIG. 5.
zGF-NH2 inhibits SV40 late gene expression, viral-induced calnexin cleavage, and cell death. (A) Immunoblots of cell lysates harvested at 96 h postinfection from confluent BS-C-1 cells either untreated (lane 1) or treated with 1 μM LCT, 2 mM zGF-NH2 in 1.4% methanol, 5 μM pepstatin A, or 15 μM aprotinin at 24 h (lanes 2 to 5) or 48 h (lanes 6 to 9). The immunoblots were probed with antisera to large T antigen (αLT), VP1 (αVP1), VP2 and VP3 (αVP2/3), and the C terminus of CNX (αCNX). (B) Confluent SV40-infected BS-C-1 coverslips were either mock treated with 1.4% MeOH or treated with 2 mM zGF-NH2 in 1.4% MeOH at 24 or 48 h postinfection, fixed at 96 h, immunostained for LT, and examined by microscopy. The phase-contrast images are representative fields from the various samples showing the clumps of dead cells (black arrowheads) in samples treated only with MeOH that are absent from those receiving zGF-NH2 in MeOH. The presence of LT in the corresponding fluorescent images (white arrowheads) shows that these cells are infected. Insets contain higher-magnification images demonstrating the presence of LT outside the nucleus in MeOH-treated samples, while the zGF-NH2-MeOH-treated samples show strict nuclear LT localization. P.I., postinfection, CNX, calnexin.
FIG. 6.
FIG. 6.
zGF-NH2 prevents plasma membrane permeabilization, cell death, and SV40 release. (A) Immunoblots of culture media collected at the indicated time points from BS-C-1 cells infected as in Fig. 1A and either untreated (lane 1 to 3) or treated with 1 μM LCT, 2 mM zGF-NH2 in MeOH, 5 μM pepstatin A, or 15 μM aprotinin at 24 h (lanes 4 to 15) or 48 h (lanes 16 to 27) postinfection. The media were collected at the indicated times, cellular debris was sedimented at 20,000 × g, the supernatant was retained, and ∼2% of the total media was resolved and analyzed with antisera to LT (αLT) and VP1 (αVP1). (B) Diagram of the assay used in panel C to test for the presence of infectious-particle release after the various treatments described in the legend to panel A. The media isolated at 96 h from the infected cells after the various treatments were used to infect BS-C-1 cells. Lysates from these cells were harvested at 48 h and analyzed for LT production by immunoblotting. (C) BS-C-1 cells were infected with ∼2% of the media isolated at 96 h from previously infected cells that had been subjected to the indicated treatment. At 48 h the cells were washed and trypsinized and the cell lysates were probed with antisera to LT. (D) SV40-infected BS-C-1 cells were either untreated or treated with MeOH or the indicated concentration of zGF-NH2 in MeOH at 24 h postinfection. Cells were collected at 96 h postinfection and subjected to trypan blue staining. The percentages of ∼1,000 cells staining positive for trypan blue are displayed. (E) SV40-infected BS-C-1 cells were either untreated (lane 1) or treated with MeOH (lanes 2, 4, and 6) or the indicated concentration of zGF-NH2 in MeOH at 24 h postinfection (lanes 3, 5, and 7). The culture media were collected at 96 h postinfection as described in the legend to panel A, immunoblotted for VP1 and LT (lanes 1 to 7), and assayed for the presence of infectious particles (lanes 8 to 14) as described in the legends for panels B and C. P.I., postinfection.
FIG. 7.
FIG. 7.
VP2 permeabilizes E. coli, while VP3 permeabilization results in the lysis of the bacterial cells. (A) E. coli was pulsed for 10 min with [35S]Met-Cys in the absence or presence of the membrane-impermeable protein synthesis inhibitor hygromycin B prior to inducing the expression of VP1, VP2, or VP3 with C-terminal His tags (lanes 1 and 2) at the indicated time postinduction of these constructs with IPTG (lanes 3 to 8). Rifampin was included during the induction to inhibit endogenous E. coli protein synthesis. Bacteria were sedimented, lysed, and resolved by 12% reducing SDS-PAGE followed by autoradiography. Additionally, the expressed protein synthesized 60 min postinduction in the absence of hygromycin B was isolated by Ni-nitrilotriacetic acid Sepharose beads (Ni-NTA). (B) E. coli viability was monitored by measuring the OD at 600 nm before and after inducing the expression of VP1, VP2, or VP3 with C-terminal His tags or VP2 and VP3 with N-terminal GST tags. The plots displayed are representative of three independent experiments. (C) E. coli containing inducible expression plasmids for GST-VP2 and GST-VP3 was pulsed for 10 min with [35S]Met-Cys in the absence (−) or presence (+) of the membrane-impermeable protein synthesis inhibitor hygromycin B prior to induction, or at the indicated time postinduction with IPTG. Samples were analyzed as in panel A with glutathione-agarose beads used for the isolation. Hygro B, hygromycin B; GSH-Ag, glutathione-agarose.

References

    1. Barouch, D. H., and S. C. Harrison. 1994. Interactions among the major and minor coat proteins of polyomavirus. J. Virol. 68:3982-3989. - PMC - PubMed
    1. Berger, N. A. 1985. Poly(ADP-ribose) in the cellular response to DNA damage. Radiat. Res. 101:4-15. - PubMed
    1. Brady, J., J. B. Bolen, M. Radonovich, N. Salzman, and G. Khoury. 1984. Stimulation of simian virus 40 late gene expression by simian virus 40 tumor antigen. Proc. Natl. Acad. Sci. USA 81:2040-2044. - PMC - PubMed
    1. Brostrom, M. A., C. R. Prostko, D. Gmitter-Yellen, L. J. Grandison, G. Kuznetsov, W. L. Wong, and C. O. Brostrom. 1991. Inhibition of translational initiation by metalloendoprotease antagonists. Evidence for involvement of sequestered Ca2+ stores. J. Biol. Chem. 266:7037-7043. - PubMed
    1. Burkle, A. 2005. Poly(ADP-ribose). The most elaborate metabolite of NAD+. FEBS J. 272:4576-4589. - PubMed

Publication types

MeSH terms

Substances

LinkOut - more resources