The role of race and poverty in access to foods that enable individuals to adhere to dietary guidelines
- PMID: 16776877
- PMCID: PMC1636719
The role of race and poverty in access to foods that enable individuals to adhere to dietary guidelines
Abstract
Introduction: The increase in obesity and disparities in obesity and related chronic diseases across racial and ethnic and income groups have led researchers to focus on the social and environmental factors that influence dietary intake. The question guiding the current study was whether all communities have equal access to foods that enable individuals to make healthy dietary choices.
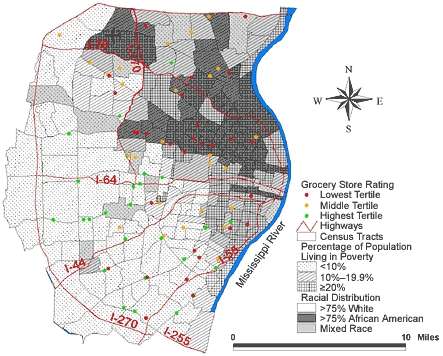
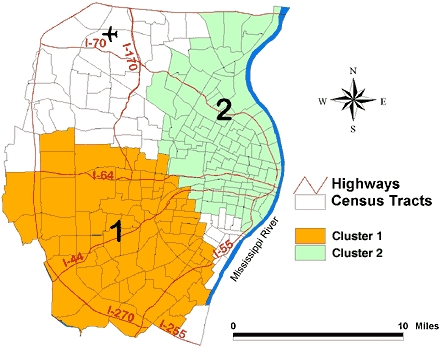
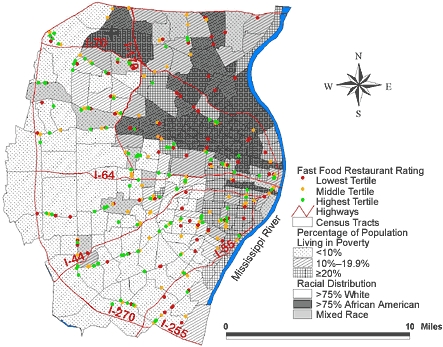
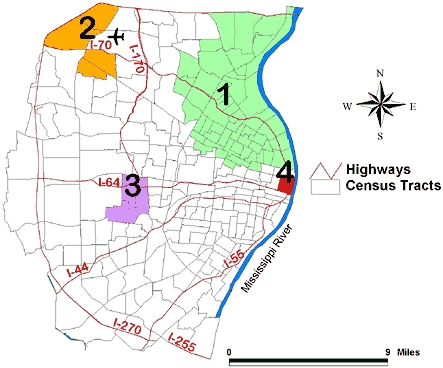
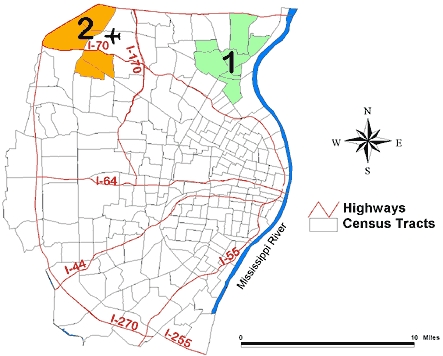
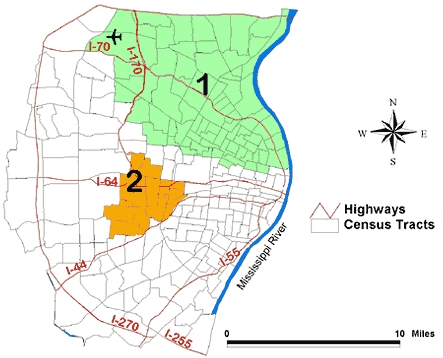
Methods: We conducted audits of community supermarkets and fast food restaurants to assess location and availability of food choices that enable individuals to meet the dietary guidelines established by the U.S. Department of Agriculture (e.g., fruit and vegetable consumption, low-fat options). We used 2000 census data to assess the racial distribution and the percentage of individuals living below the federal poverty level in a defined area of St Louis, Mo. Spatial clustering of supermarkets and fast food restaurants was determined using a spatial scan statistic.
Results: The spatial distribution of fast food restaurants and supermarkets that provide options for meeting recommended dietary intake differed according to racial distribution and poverty rates. Mixed-race or white high-poverty areas and all African American areas (regardless of income) were less likely than predominantly white higher-income communities to have access to foods that enable individuals to make healthy choices.
Conclusion: Without access to healthy food choices, individuals cannot make positive changes to their diets. If certain eating behaviors are required to reduce chronic disease and promote health, then some communities will continue to have disparities in critical health outcomes unless we increase access to healthy food.
Figures
References
-
- National Center for Health Statistics. Prevalence of overweight and obesity among adults: United States, 1999-2002 [Internet] Hyattsville (MD): Centers for Disease Control and Prevention, National Center for Health Statistics; 2004. Available from: URL: http://www.cdc.gov/nchs/products/pubs/pubd/hestats/obese/obse99.htm .
-
- Flegal KM, Carroll MD, Ogden CL, Johnson CL. Prevalence and trends in obesity among US adults, 1999-2000. JAMA. 2002;288(14):1723–1727. - PubMed
-
- Katz DL, O'Connell M, Yeh MC, Nawaz H, Njike V, Anderson LM, et al. Public health strategies for preventing and controlling overweight and obesity in school and worksite settings: a report on recommendations of the Task Force on Community Preventive Services. MMWR Recomm Rep 2005;54(RR-10):1–12. - PubMed
-
- Mokdad AH, Serdula MK, Dietz WH, Bowman BA, Marks JS, Koplan JP. The spread of the obesity epidemic in the United States, 1991-1998. JAMA. 1999;282(16):1519–1122. - PubMed
-
- Weinsier RL, Hunter GR, Heini AF, Goran MI, Sell SM. The etiology of obesity: relative contribution of metabolic factors, diet and physical activity. Am J Med. 1998;105(2):145–150. - PubMed
Publication types
MeSH terms
Grants and funding
LinkOut - more resources
Full Text Sources