Review
. 2006 Aug;40(2):175-90.
doi: 10.1016/j.ceca.2006.04.022. Epub 2006 Jun 13.

Thalamic T-type Ca2+ channels and NREM sleep

Affiliations
Review

Thalamic T-type Ca2+ channels and NREM sleep

Vincenzo Crunelli et al. Cell Calcium. 2006 Aug.

Abstract

T-type Ca2+ channels play a number of different and pivotal roles in almost every type of neuronal oscillation expressed by thalamic neurones during non-rapid eye movement (NREM) sleep, including those underlying sleep theta waves, the K-complex and the slow (<1 Hz) sleep rhythm, sleep spindles and delta waves. In particular, the transient opening of T channels not only gives rise to the 'classical' low threshold Ca2+ potentials, and associated high frequency burst of action potentials, that are characteristically present during sleep spindles and delta waves, but also contributes to the high threshold bursts that underlie the thalamic generation of sleep theta rhythms. The persistent opening of a small fraction of T channels, i.e. I(Twindow), is responsible for the large amplitude and long lasting depolarization, or UP state, of the slow (<1 Hz) sleep oscillation in thalamic neurones. These cellular findings are in part matched by the wake-sleep phenotype of global and thalamic-selective CaV3.1 knockout mice that show a decreased amount of total NREM sleep time. T-type Ca2+ channels, therefore, constitute the single most crucial voltage-dependent conductance that permeates all activities of thalamic neurones during NREM sleep. Since I(Twindow) and high threshold bursts are not restricted to thalamic neurones, the cellular neurophysiology of T channels should now move away from the simplistic, though historically significant, view of these channels as being responsible only for low threshold Ca2+ potentials.


Figures

Figure 1
Figure 1. The thalamo-cortico-thalamic loop and the EEG waves of NREM sleep
A. Schematic diagram of the afferent and efferent connections among the principal neuronal elements of the thalamo-cortico-thalamic loop. For clarity, intracortical networks are not included, though it is worth highlighting that thalamocortical afferents arrive in layer IV and corticothalamic efferents mainly originate from layer V/VI. (+): excitatory synapse, (−): inhibitory synapse. B. Human EEG showing characteristic waves of relaxed wakefulness and NREM sleep. B: reproduced from ref. [27].
Figure 2
Figure 2. Current view of T channel neurophysiology
A. The classical view of T-type Ca2+ channel neurophysiology highlights their role in the LTCPs that underlie the burst firing (and delta oscillation) generated by TC neurones when their membrane potential is more negative than −65 mV. B. The current view is that in addition to LTCPs T channels contribute to two additional cellular activities: 1) the high threshold bursts (HTBs), that are due to the transient opening of possibly dendritic T channels (see box in the top far right), and 2) the UP state of the slow (<1 Hz) oscillation, that is due to the opening of non-inactivating T channels in the voltage region around −60mV (see box in the middle far right). The unmasking of these additional T channel-dependent activities is possible when the metabotropic glutamate receptors that are postsynaptic to the cortical afferents to TC neurones are activated either synaptically (see Fig. 5 in ref. [21] and Fig. 3B in ref. [22]) or exogenously (as shown here using 100 μM trans-ACPD). Note how this activation of the cortical afferents has enlarged the repertoire of firing patterns that involves T channel activation without affecting their ability to generate both tonic or burst firing/delta oscillations. A and B: reproduced from ref. [91].
Figure 3
Figure 3. Sleep theta waves and HTBs
A. Simultaneous field and single unit recordings in vivo from animals undergoing natural sleep-wake cycles show short bursts of action potentials (with almost constant interspike intervals, ISIs) during alpha and theta waves (marked portions of the traces are enlarged on the right). B. Intracellular recordings of HTBs in a TC neurone in vitro, showing how increasing tonic hyperpolarization shifts HTB firing from alpha to theta frequency. C. HTBs are abolished by Ni2+, so that in this condition the TC neuron fires single action potentials. D. ISIs of HTBs are markedly different from those of LTCPs, recorded in the same TC neurone. E. Pharmacological profile of high threshold (HT)-spikes (E1) and high threshold (HT)-bursts (E2). All sections of this figure are reproduced from ref. [23].
Figure 4
Figure 4. Sleep K-complex and the role of ITwindow in slow (< 1Hz) oscillation
A. In vivo simultaneously recorded EEG K-complexes and cortical slow (<1 Hz) sleep oscillation (A1) highlight the synchrony between the K-complex and the slow oscillation in a single cortical neurone. A1 and A2. Slow (<1 Hz) sleep oscillations recorded in vitro from an NRT and a TC neurone highlight how the switching ‘on’ (green area) and ‘off’ (yellow area) of ITwindow underlies the generation of the UP and DOWN states, respectively, of the oscillation (marked portions of the traces are enlarged on the right). B1. The overlap (grey area) of the steady-state activation and inactivation curves of IT indicate the very small proportion of T channels responsible for ITwindow. B2. Plot of the absolute value of the normal and a reduced ITwindow (black and red bell-shaped curves) and a large and a small ILeak (blue and green line, respectively). B3. Net current-voltage plot for the colour coded conditions depicted in B2: bistability, i.e. two stable membrane potentials (filled and empty circle), is present for the green but not for the blue or red lines. C1. In an originally bistable TC neurone where IT (and thus bistability) had been eliminated by Ni2+, bistability can be re-instated by adding an amount of computer-generated IT commensurate with the apparent ILeak of that neurone (top traces), such that the net current-voltage plot for that neurone satisfies the theoretical prediction (green line in plot). Bistability, however, is lost (bottom traces), when artificial IT is slightly decreased (red line in plot). C2. Even in the presence of a reduced ITwindow (red line in plot), bistability can be re-introduced by adding a steady current to the neurone, since this procedure will re-instate two stable equilibrium points in the net current-voltage plot (arrow in plot). See ref. [88] for a full description of this and other experiments related to the role of ITwindow in the slow (<1 Hz) sleep oscillation. A1 and C: reproduced from refs. [73] and [88], respectively.
Figure 5
Figure 5. EEG spindle waves and their thalamic counterparts
A. EEG spindle wave under barbiturate anaesthesia. B. Intracellular recording from an NRT neurone in vivo under barbiturate anaesthesia shows how the LTCPs are superimposed on a depolarizing envelope during a spindle wave (top trace), whereas this depolarizing envelope is absent in the intracellular recordings from a neurone in the PGN (the visual sector of the NRT) in vitro during a spindle wave (bottom trace) (enlarged in the top trace of the bottom right box). C. Intracellular recordings from a TC neurone in vivo (under barbiturate anaesthesia, top trace) and in vitro (bottom trace) show that the NRT-evoked IPSPs occasionally give rise to LTCPs (enlarged in the bottom trace of the bottom right box). D. EEG spindle wave occurring in close association with a K-complex under ketamine/xylazine anaesthesia. E. Intracellular recordings during a spindle wave associated with a K-complex (top trace) in a ketamine/xylazine anaesthetized preparation show how the spindle wave occurs on the UP state of the slow (<1 Hz) sleep oscillation. The bottom trace shows intracellular recordings from an NRT neurone with activity at spindle frequency occurring on the UP state of the slow oscillation (during exogenous activation of mGluR1a with 100 μM of trans-ACPD). A, B, C, D and E: reproduced from refs. [14], [15], and [95], respectively.
Figure 6
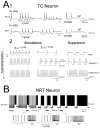
Figure 6. Delta waves are grouped by the slow (<1 Hz) sleep oscillation
A1. Intracellular recordings from TC neurones in vivo and in vitro show groups of LTCPs at delta frequency in the DOWN state of the slow (<1 Hz) sleep oscillation. One transition of the DOWN to the UP state is enlarged on the right to highlight the last LTCP occurring during the DOWN state and the LTCP at the start of the UP state. A2. Computer simulations indicate the essential role of ICAN in generating periods of grouped delta oscillations during the slow oscillation, and its similarity to the experimental findings. Note also how increasing steady hyperpolarization leads from a slow oscillation with grouped LTCPs at delta frequency (middle traces) to continuous delta oscillations (bottom traces). B. Intracellular recording of the slow (<1 Hz) sleep oscillation in an NRT neurone in vitro and the presence of grouped delta activity during the DOWN state of the slow (<1 Hz) sleep oscillation. A1(top trace), A1 (bottom trace), A2 and B: reproduced from refs. [82], [21] and [22], respectively.
Figure 7
Figure 7. CaV3.1 KO mice have a reduced NREM sleep
NREM sleep time in CaV3.1 KO mice generated by Lee et al. [25] (A), and in the global, thalamic-selective and cortical-selective CaV3.1 KO mice developed by Anderson et al. [26] (B). Note how a reduced amount of total NREM sleep time occurs in the light (A) and dark (B) period, respectively. A and B: reproduced from refs. [25] and [26], respectively.

References

    1. Llinas R, Jahnsen H. Electrophysiology of mammalian thalamic neurones in vitro. Nature. 1982;297:406–408. - PubMed
    1. Andersen P, Andersson SA. Physiological basis of the alpha rhythm. Century Crofts; New York: 1968.
    1. Jahnsen H, Llinas R. Electrophysiological properties of guinea-pig thalamic neurones: an in vitro study. J. Physiol. (Lond.) 1984;349:205–226. - PMC - PubMed
    1. Jahnsen H, Llinas R. Ionic basis for the electro-responsiveness and oscillatory properties of guinea-pig thalamic neurones in vitro. J. Physiol. (Lond.) 1984;349:227–247. - PMC - PubMed
    1. Deschenes M, Paradis M, Roy JP, Steriade M. Electrophysiology of neurons of lateral thalamic nuclei in cat: resting properties and burst discharges. J. Neurophysiol. 1984;51:1196–1219. - PubMed

Publication types

Substances