. 2006 Jun 7;273(1592):1307-16.
doi: 10.1098/rspb.2006.3466.

Epidemic dynamics and antigenic evolution in a single season of influenza A

Affiliations

Epidemic dynamics and antigenic evolution in a single season of influenza A

Maciej F Boni et al. Proc Biol Sci. .

Abstract

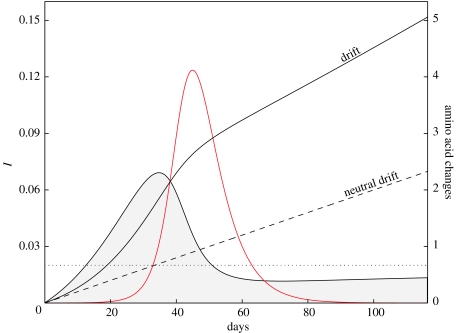
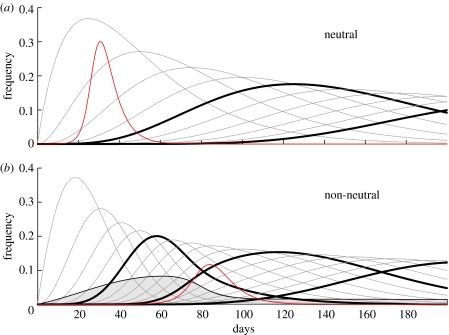
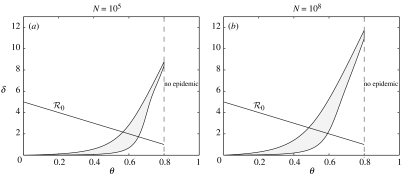
We use a mathematical model to study the evolution of influenza A during the epidemic dynamics of a single season. Classifying strains by their distance from the epidemic-originating strain, we show that neutral mutation yields a constant rate of antigenic evolution, even in the presence of epidemic dynamics. We introduce host immunity and viral immune escape to construct a non-neutral model. Our population dynamics can then be framed naturally in the context of population genetics, and we show that departure from neutrality is governed by the covariance between a strain's fitness and its distance from the original epidemic strain. We quantify the amount of antigenic evolution that takes place in excess of what is expected under neutrality and find that this excess amount is largest under strong host immunity and long epidemics.


Figures

Figure 1
Figure 1
Results from integrating the modified model (3.6)–(3.10). β=1.0, θ=0.6, a=0.1, N=105; μ=0.02 is marked by the dashed line. The red line represents the force of infection I (left-hand scale). The curve bounding the filled area is βQ Cov (left-hand scale) from equation (3.13) and shows here that selection for new variants is more intense in the beginning phases of the epidemic. Comparing the covariance term with the dotted line (μ) shows the relative non-neutral and neutral contributions to total antigenic drift. The two drift lines correspond to values on the right-hand vertical scale. After about 116 days, the epidemic is over and the mean number of amino acid changes is around five; under neutral drift we would expect about two.
Figure 2
Figure 2
The solid black lines represent the frequencies i1, i2, i3 and so on (i0 is not shown). Every fifth variant has a bold line so that (a) and (b) can be compared. In (a), i5 and i10 are bold; in (b), i5, i10 and i15 are bold. In (a) and (b), β=0.6, ν=0.2, μ=0.04, a=0.1 and I(0)=10−5. In (a), θ=0.0, R0=3. In (b), θ=0.6, and the effective R0=1.2. The red line represents the force of infection I. In (b), the solid curve bounding the filled area corresponds to the term βQ Cov from the Price equation (3.13).
Figure 3
Figure 3
Excess drift as a function of herd immunity. In (a) and (b), the two curves bounding the filled area show the value of δ for μ=0.05 (upper curve) and μ=0.005 (lower curve). In (a) and (b), β=1.0, ν=0.2 and a=0.05. The negatively sloped straight line in both panels shows R0 as a function of θ. When θ>0.8, the effective basic reproduction ratio is less than 1 and there is no epidemic.
Figure 4
Figure 4
In (a)–(c), β=0.6, ν=0.2, θ=0.3 (effective R0=2.1 for the zero-strain), μ=0.02 and I(0)=10−5; a=0.1, 0.5, 3.0 in (a), (b) and (c), respectively. The red line represents the force of infection I and corresponds to the red axis on the right-hand side of the graph. The solid curve bounding the filled area corresponds to the term βQ Cov from the Price equation (3.13). The shaded area under this curve is the value of the integral of βQ Cov from 0 to tf; this is the excess antigenic drift. Graph (b) maximizes the area under the covariance curve. The value a=3.0 is used for illustrative effect only.

References

    1. Anderson R.M, May R.M. Oxford Science Publications; Oxford, UK: 1991. Infectious diseases of humans: dynamics and control.
    1. Andreasen V. Dynamics of annual influenza A epidemics with immuno-selection. J. Math. Biol. 2003;46:504–536. 10.1007/s00285-002-0186-2 - DOI - PubMed
    1. Andreasen V, Levin S, Lin J. A model of influenza A drift evolution. Z. Angew. Math. Mech. 1996;76:421–424.
    1. Antia R, Regoes R.R, Koella J.C, Bergstrom C.T. The role of evolution in the emergence of infectious diseases. Nature. 2003;426:658–661. 10.1038/nature02104 - DOI - PMC - PubMed
    1. Boni M.F, Gog J.R, Andreasen V, Christiansen F.B. Influenza drift and epidemic size: the race between generating and escaping immunity. Theor. Popul. Biol. 2004;65:179–191. 10.1016/j.tpb.2003.10.002 - DOI - PubMed

Publication types