Comparative Study
. 2006 Aug 15;575(Pt 1):69-81.
doi: 10.1113/jphysiol.2006.112367. Epub 2006 Jun 15.

Sarcoplasmic reticulum Ca2+ release and depletion fail to affect sarcolemmal ion channel activity in mouse skeletal muscle

Affiliations
Comparative Study

Sarcoplasmic reticulum Ca2+ release and depletion fail to affect sarcolemmal ion channel activity in mouse skeletal muscle

Bruno Allard et al. J Physiol. .

Abstract

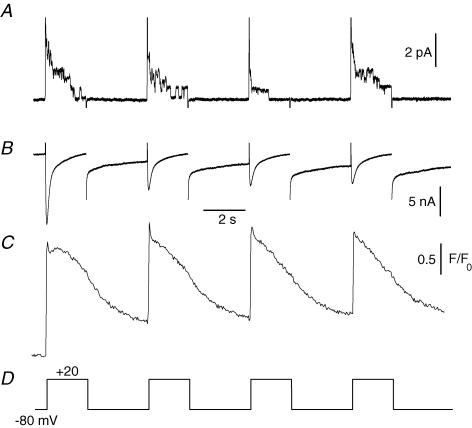
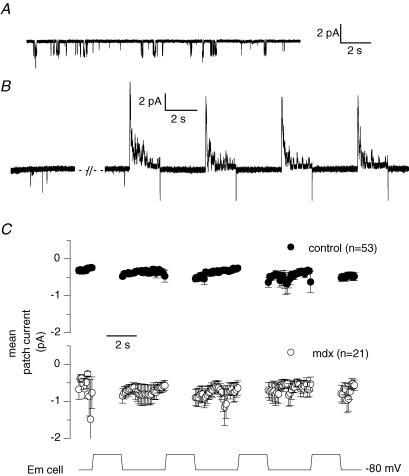
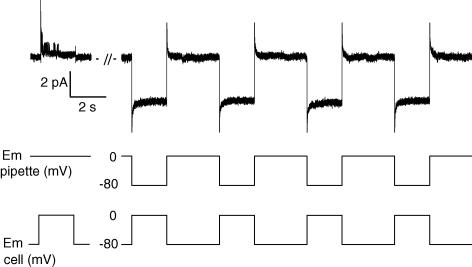
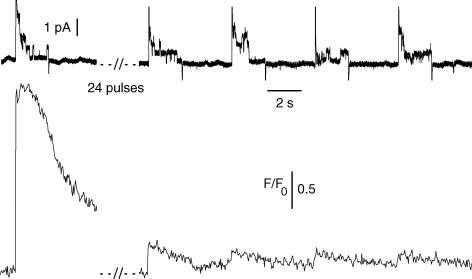
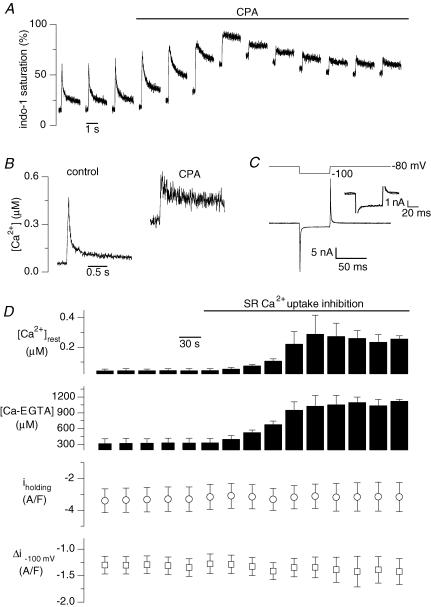
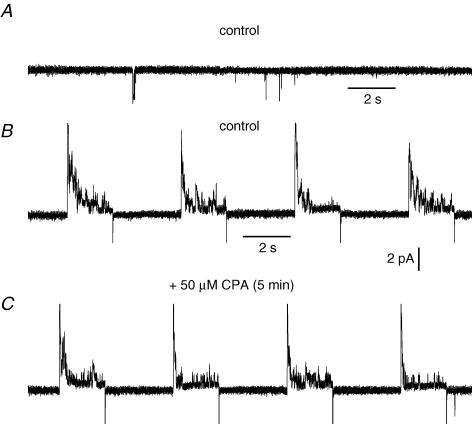
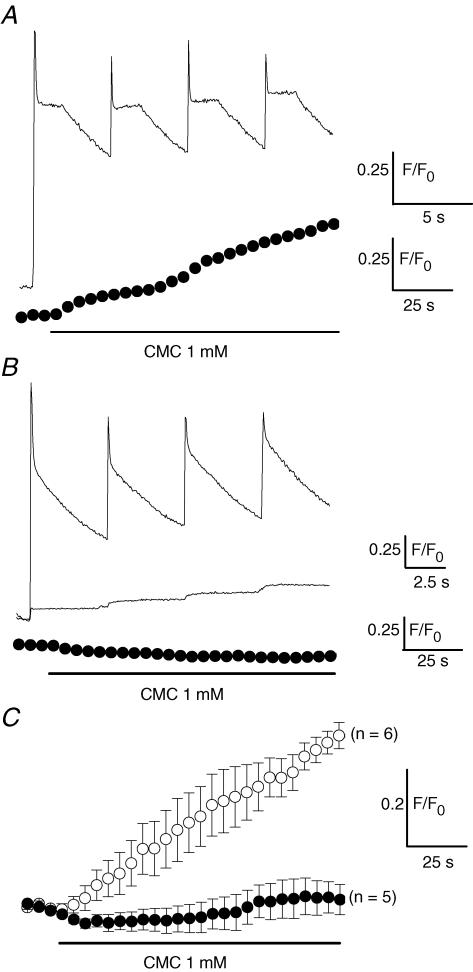
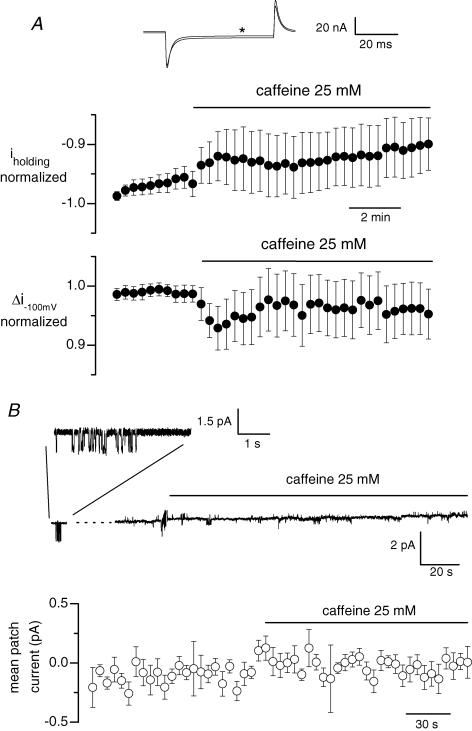
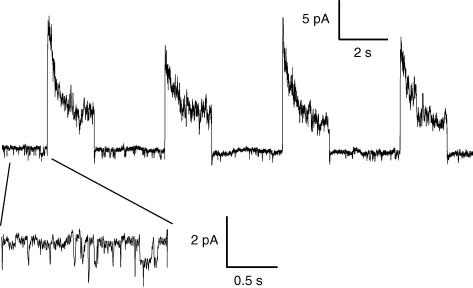
In skeletal muscle, sarcoplasmic reticulum (SR) Ca2+ depletion is suspected to trigger a calcium entry across the plasma membrane and recent studies also suggest that the opening of channels spontaneously active at rest and possibly involved in Duchenne dystrophy may be regulated by SR Ca2+ depletion. Here we simultaneously used the cell-attached and whole-cell voltage-clamp techniques as well as intracellular Ca2+ measurements on single isolated mouse skeletal muscle fibres to unravel any possible change in membrane conductance that would depend upon SR Ca2+ release and/or SR Ca2+ depletion. Delayed rectifier K+ single channel activity was routinely detected during whole-cell depolarizing pulses. In addition the activity of channels carrying unitary inward currents of approximately 1.5 pA at -80 mV was detected in 17 out of 127 and in 21 out of 59 patches in control and mdx dystrophic fibres, respectively. In both populations of fibres, large whole-cell depolarizing pulses did not reproducibly increase this channel activity. This was also true when, repeated application of the whole-cell pulses led to exhaustion of the Ca2+ transient. SR Ca2+ depletion produced by the SR Ca2+ pump inhibitor cyclopiazonic acid (CPA) also failed to induce any increase in the resting whole-cell conductance and in the inward single channel activity. Overall results indicate that voltage-activated SR Ca2+ release and/or SR Ca2+ depletion are not sufficient to activate the opening of channels carrying inward currents at negative voltages and challenge the physiological relevance of a store-operated membrane conductance in adult skeletal muscle.


Figures

Figure 1
Figure 1. Combined electrophysiological and fluorescence measurements in a muscle fibre
Simultaneous recordings of single channel activity (A), macroscopic current (B) and intracellular [Ca2+] changes (C) in the same voltage-clamped skeletal muscle fibre. Four consecutive depolarizing pulses of 2 s duration with 3 s intervals were applied to the fibre as indicated in D. [Ca2+] was detected with fluo-3. The fibre had been injected with an EGTA-containing solution (see Methods); following equilibration, the final intracellular EGTA concentration was estimated to be ∼20 mm.
Figure 2
Figure 2. Single channel activity before and after whole-cell depolarizing pulses in control and in mdx muscle fibres
A, current trace showing single channel activity in a cell-attached patch established on a voltage-clamped control fibre maintained at −80 mV. B, current trace corresponding to the single channel activity in another cell-attached patch obtained from a control voltage-clamped cell maintained at −80 mV (left panel) and depolarized by four consecutive whole-cell pulses of 2 s duration to 0 mV (right panel). C, average single channel activity detected at the holding whole-cell voltage of −80 mV in cell-attached patches experiencing the whole-cell protocol consisting of four 2 s-long depolarizing pulses. Depolarization levels were between −10 and +30 mV. Single channel current traces were exclusively obtained from cell-attached patches exhibiting the inward channel activity at −80 mV. For each record the current level corresponding to the closed state of the channel carrying inward current was set to zero. The single channel current was then averaged over successive intervals of 100 ms. The graph presents the corresponding mean cell-attached patch current obtained from 53 records taken from 17 patches established on control fibres (•) and from 21 records taken from 9 patches established on mdx fibres (○). In all fibres the intracellular EGTA concentration was estimated to be ∼20 mm.
Figure 3
Figure 3. Single channel activity recorded during depolarizing pulses applied to the fibre while the cell-attached patch is maintained at −80 mV
The left part of the current trace (upper panel) shows single channel activity recorded in a cell-attached patch in response to a single pulse of 2 s duration from −80 to 0 mV in a control fibre. The right part of the current trace shows single channel activity recorded in the same cell-attached patch in response to four consecutive pulses of 2 s duration given from −80 to 0 mV in the fibre and simultaneously from 0 to +80 mV in the patch pipette (which results in holding the membrane patch at −80 mV). The middle and lower panels show the voltage protocols applied in the pipette and in the fibre, respectively. The intracellular EGTA concentration was estimated to be ∼20 mm.
Figure 4
Figure 4. Single channel activity recorded in response to series of depolarizing pulses leading to Ca2+ signal exhaustion
The upper trace shows the current recorded in the cell-attached patch pipette in response to a first depolarizing pulse to +20 mV applied in a control fibre and to four consecutive pulses of the same amplitude applied in the same fibre after 25 such pulses had been given. The lower trace shows the corresponding fluo-3 Ca2+ transients induced by the voltage pulses. The intracellular EGTA concentration was estimated to be ∼20 mm.
Figure 5
Figure 5. Effect of cyclopiazonic acid (CPA) on macroscopic background current and Ca2+ transients induced by depolarizations of the fibre
The trace in A shows the indo-1 transients induced by 50 ms pulses to +10 mV applied every 30 s in a control fibre. The horizontal bar indicates the period during which CPA at a concentration of 50 μm was present in the external solution. The left and the right panels in B show the first indo-1 transient obtained in the presence of the control external solution and the last indo-1 transient obtained in the presence of the CPA-containing external solution, respectively. In C, the first membrane current record measured in response to a 20 mV hyperpolarization in the presence of the control external solution is shown superimposed on the last membrane current record obtained in response to the same pulse in the presence of the CPA-containing external solution. The corresponding voltage protocol is shown on top. The inset shows an enlarged view of the same two current traces; the thin trace corresponds to the control current whereas the thick trace corresponds to the one measured in CPA. In D, mean results from 4 experiments similar to the one shown in A are presented. It shows the mean values for resting [Ca2+], corresponding mean resting concentration of Ca2+–EGTA complex, background current at −80 mV and change in membrane current induced by the 20 mV hyperpolarization, along the course of the experiments. For these experiments the intracellular EGTA concentration was estimated to be ∼2 mm (see Methods).
Figure 6
Figure 6. Effect of cyclopiazonic acid on single channel activity recorded on fibres stimulated by repetitive depolarizations
The current trace in A shows single channel activity in a cell-attached patch obtained on a voltage-clamped control fibre maintained at −80 mV. The current trace in B shows single channel activity in the same cell-attached patch in response to four consecutive depolarizing pulses to 0 mV in the presence of a control external solution. The current trace in C shows single channel activity in the same cell-attached patch in response to four consecutive depolarizing pulses to 0 mV after a 5 min treatment with cyclopiazonic acid during which 16 depolarizing pulses to 0 mV were delivered. The intracellular EGTA concentration was estimated to be ∼20 mm.
Figure 7
Figure 7. Effect of 4-chloro-m-cresol (CMC) on intracellular fluo-3 Ca2+ signals in fibres exposed to the control solution and in fibres treated with CPA
The upper trace in A shows the fluo-3 Ca2+ transients induced by four successive voltage pulses given from −80 to 0 mV in the presence of control external solution. The lower trace presents, in the same fibre, the change in the fluo-3 Ca2+ signal produced by CMC at −80 mV. In B, the upper trace corresponds to the Ca2+ transients induced by a first series of four depolarizing pulses given from −80 to 0 mV in the presence of control external solution in another fibre. The middle trace shows, in this same fibre, the Ca2+ transients elicited in response to the same voltage pulses after 2 min CPA treatment during which 4 other same pulses were delivered. The lower trace shows, in the same fibre, the fluo-3 fluorescence signal produced upon application of CMC at −80 mV. CMC was applied 30 s after the above shown Ca2+ transients were recorded in the presence of CPA. In C are presented the mean changes in intracellular [Ca2+] induced by CMC at −80 mV in 6 fibres solely challenged with one series of depolarizing pulses and bathed throughout with the control external solution (○) and in 5 fibres first challenged with several series of depolarizing pulses in the presence of CPA until there was exhaustion of the voltage-activated Ca2+ transients (•). Each fluo-3 fluorescence data point presented for CMC experiments corresponds to the mean change in fluorescence measured in 5 consecutive images captured every second. In all fibres the intracellular EGTA concentration was estimated to be ∼20 mm.
Figure 8
Figure 8. Effect of caffeine on whole-cell background current and single channel activity in fibres that were free of silicone
In A, fibres were voltage-clamped using the whole-cell configuration of the patch-clamp technique with the pipette solution containing 20 mm internal EGTA. The holding voltage was set to −80 mV and 50 ms pulses to −100 mV were applied every 20 s. The upper panel shows the last membrane current record measured in response to a 20 mV hyperpolarization in the presence of the control external solution, superimposed on the membrane current record obtained in response to the same pulse applied 8 min and 40 s after addition of caffeine (record marked by a star). The middle and lower panels show the mean normalized value of the whole-cell background current at −80 mV and the mean change in membrane current induced by the 20 mV hyperpolarization, respectively, along the course of such experiments. Data are from 12 cells. In B, the upper panel shows the single channel activity recorded in a cell-attached patch established on a fibre previously bathed for 30 min in a Tyrode solution containing 250 μm EGTA-AM. The holding pipette potential was 0 mV. Activity of channels carrying inward current, illustrated on an expanded scale in the inset shown on top, was detected 2 min 30 s before the beginning of the continuous recording. The lower panel shows mean values for the patch current from 8 identical experiments. In each single channel record, the closed channel state was set to zero and the current value was averaged over successive intervals of 5 s; the graph shows the corresponding mean current versus time.
Figure 9
Figure 9. Single channel activity recorded in response to series of depolarizing pulses in mdx muscle fibres
The main trace shows the single channel activity in the cell-attached patch in response to 4 depolarizing pulses given to 0 mV. Inset shows a short segment of the current trace on an expanded scale. The intracellular EGTA concentration was estimated to be ∼20 mm.

References

    1. Albert AP, Large WA. A Ca2+-permeable non-selective cation channel activated by depletion of internal Ca2+ stores in single rabbit portal vein myocytes. J Physiol. 2002;538:717–728. - PMC - PubMed
    1. Cherednichenko G, Hurne AM, Fessenden JD, Lee EH, Allen PD, Beam KG, Pessah IN. Conformational activation of Ca2+ entry by depolarization of skeletal myotubes. Proc Natl Acad Sci U S A. 2004;101:15793–15798. - PMC - PubMed
    1. Collet C, Allard B, Tourneur Y, Jacquemond V. Intracellular calcium signals measured with indo-1 in isolated skeletal muscle fibres from control and mdx mice. J Physiol. 1999;520:417–429. - PMC - PubMed
    1. Collet C, Csernoch L, Jacquemond V. Intramembrane charge movement and L-type calcium current in skeletal muscle fibers isolated from control and mdx mice. Biophys J. 2003;84:251–265. - PMC - PubMed
    1. Collet C, Jacquemond V. Sustained release of calcium elicited by membrane depolarization in ryanodine-injected mouse skeletal muscle fibers. Biophys J. 2002;82:1509–1523. - PMC - PubMed

Publication types

MeSH terms