. 2006 Sep 1;575(Pt 2):417-31.
doi: 10.1113/jphysiol.2006.110437. Epub 2006 Jun 15.

Mode shifts in the voltage gating of the mouse and human HCN2 and HCN4 channels

Affiliations

Mode shifts in the voltage gating of the mouse and human HCN2 and HCN4 channels

Fredrik Elinder et al. J Physiol. .

Abstract

Hyperpolarization-activated, cyclic-nucleotide-gated (HCN) channels regulate pacemaker activity in the heart and the brain. Previously, we showed that spHCN and HCN1 channels undergo mode shifts in their voltage dependences, shifting the conductance versus voltage curves by more than +50 mV when measured from a hyperpolarized potential compared to a depolarized potential. In addition, the kinetics of the ionic currents changed in parallel to these voltage shifts. In the studies reported here, we tested whether slower cardiac HCN channels also display similar mode shifts. We found that HCN2 and HCN4 channels expressed in oocytes from the frog Xenopus laevis do not display the activation kinetic changes that we observed in spHCN and HCN1. However, HCN2 and HCN4 channels display changes in their tail currents, suggesting that these channels also undergo mode shifts and that the conformational changes underlying the mode shifts are due to conserved aspects of HCN channels. With computer modelling, we show that in channels with relatively slow opening kinetics and fast mode-shift transitions, such as HCN2 and HCN4 channels, the mode shift effects are not readily observable, except in the tail kinetics. Computer simulations of sino-atrial node action potentials suggest that the HCN2 channel, together with the HCN1 channel, are important regulators of the heart firing frequency and that the mode shift is an important property to prevent arrhythmic firing. We conclude that although all HCN channels appear to undergo mode shifts - and thus may serve to prevent arrhythmic firing - it is mainly observable in ionic currents from HCN channels with faster kinetics.


Figures

Figure 1
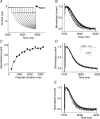
Figure 1. Tail development of HCN2 channels
A, tail currents at +50 mV in response to longer and longer prepulses (Δt = 25 ms) to −160 mV. Inset: voltage protocol. ‘1K’ bath solution. B, normalized tail currents from A. C, tail currents after the longest prepulse in B were fitted to eqn (1), where w = 3.9. D, time course of the change in tail current, measured as the tail current amplitude 50 ms after the onset of the tail potential (arrow in B), fitted with a single exponential. ‘1K’ (○), ‘100K’ (▪), and ‘100K’+ 1 mm CsCl (▴) solutions. In this experiment, the time constants were 59 ms, 580 ms and 35 ms, respectively. Holding potential (Vhold) = 0 mV in all recordings.
Figure 2
Figure 2. Voltage dependence of the tail development of HCN2 channels
A, tail currents at +50 mV in response to longer and longer prepulses (Δt = 25 ms) to −160 mV. Inset: voltage protocol. ‘1K’ bath solution. B, time constant of tail development (determined as in Fig. 1D) as a function of the prepulse potential, fitted to τ=A exp(δe0V/kT), where δ= 0.39. C, time course of the change in tail current in A (▾), measured as the tail current amplitude 50 ms after the onset of the tail potential, fitted with a single exponential. The x-axis was corrected for the relative time that the channel spent open during the prepulse, i.e. instead of plotting tail current versus prepulse length (as in Fig. 1D), we plotted tail current versus estimated cumulative time open of the channel for each prepulse. We estimated the ‘time open’=A/Imax, where A is the area under each current trace and Imax is the maximal current at that voltage calculated as Imax= (VVrev) ×Gmax. Similar experiments with prepulses to −100 mV (▪), −120 mV (•), and −140 mV (▴). D, time constant of tail development as a function of prepulse potential, after the correction (from C) for the time dependence of open probability at the different prepulse potentials. Fitted to τ=A exp(δe0V/kT), where δ= 0.17. Vhold= 0 mV in all recordings.
Figure 3
Figure 3. Tail development of cAMP-independent HCN2 channels
A, tail currents at +50 mV in response to longer and longer prepulses (Δt = 25 ms) to −160 mV, for R591E HCN2 channels (Wang et al. 2002). Inset: voltage protocol. ‘1K’ bath solution. B, normalized tail currents from A. Slower and more sigmoidal tail currents with longer prepulses. Vhold= 0 mV in all recordings.
Figure 4
Figure 4. Prepulse dependence of activation kinetics in HCN2 channels
A, a triple-pulse protocol with an activating prepulse to −140 mV (pulse 1) of increasing length (Δt = 80 ms), followed by a step to +80 mV (pulse 2, ttail= 400 ms) and an additional activating step to −140 mV (pulse 3). The increasing length of the activating prepulse (pulse 1) induced a change in tail kinetics (pulse 2) with little change in the activation kinetics (pulse 3). B, activation time constant during the second −140 mV step (i.e. pulse 3) in A for different prepulse lengths (pulse 1) (▪). Activation time constants for HCN1 channels (Vstep=−100 mV, Vtail=+80 mV) are shown for comparison (○; from Fig. 14D in Männikkö et al. 2005). C and D, a triple-pulse protocol with an activating prepulse to −100 mV (pulse 1) of increasing length (Δt = 80 ms), followed by a step to +80 mV (pulse 2, ttail= 500 ms in C and 250 ms in D) and an additional activating step to −100 mV (pulse 3). E, activation time constant during the second −100 mV step (i.e. pulse 3) in C (▪) and D (+) for different prepulse lengths (pulse 1). The decreased length of the tail step (pulse 2) in D did not lead to an increased change in the activation kinetics. Instead, more channels were still opened at the end of the tail step, as indicated by a larger instantaneous current at −100 mV in D (pulse 3). Vhold= 0 mV in all recordings.
Figure 5
Figure 5. Computer simulations of Model 1
A, open probabilities at a prepulse-activation step to −130 mV, followed by a tail step to 0 mV and a subsequent reactivation step to −130 mV. The length of the prepulse step varied between 50 and 450 ms, in increments of 50 ms. B, normalized tail currents from A. For κ= 10 s−1 and 1 s−1, there was a clear difference in the tail currents. The tails were slower after longer prepulses. C, reactivation currents from A. Reactivation was faster after longer prepulses. For all simulations: VI=−120 mV, VII=−60 mV, z = 2, k = 10 s−1, κ as indicated. Arrows in B and C indicate the time points used for the analysis in Fig. 6.
Figure 6
Figure 6. Analysis of computer simulations shown in Fig. 5
A, tail current amplitude 10 ms after onset of the pulse (indicated with arrows in Fig. 5B) plotted versus the prepulse length for κ values as indicated. B, tail current amplitude (after 10 ms) after an activating prepulse to −130 mV for 50 ms, divided by the tail current amplitude after a prepulse of 500 ms for different κ values. C, reactivation amplitude 100 ms after onset of the pulse (indicated with arrows in Fig. 5C), plotted versus the prepulse length for different values of κ (as indicated). D, reactivation current amplitude (after 100 ms) after an activating prepulse to −130 mV for 50 ms, divided by the reactivation current after a prepulse of 500 ms for different κ values. The dashed line shows similar analysis for the time constant during reactivation after 50 and 50 ms prepulses. E, data from B and D are plotted as relative deviations from 1 and are normalized to the maximum deviation. Note that here, k /κ is used as the x axis (k = 10). Arrows indicate k /κ values in ‘1K’; data from Table 1. ‘100K’ shifts the arrows to the right.
Figure 7
Figure 7. Prepulse-dependent tail currents in HCN4
A, tail currents at +50 mV in response to prepulses of different lengths (Δt = 250 ms) to −160 mV. ‘100K’ bath solution. B, normalized tail currents from A. Note increased sigmoidicity with increased prepulse length. C, time course of delay development, measured as the tail current amplitude 100 ms after the onset of the tail potential, fitted with a single exponential, τ= 667 ms. D and E, same type of recording as in B, D in ‘100K’+ 1 mm CsCl solution, E in ‘1K’ solution. Vhold= 0 mV in all recordings.
Figure 8
Figure 8. In HCN channels with a wide range of activation kinetics, a mode shift stabilizes the firing rate
A, the last 1.5 s of a 5 s simulation of a sino-atrial node cell with a two-state HCN channel without a mode shift (ΔVmode= 0 mV). The activation rate k was 18 s−1 in this simulation. The simulation procedures and equations followed those of; V½=−75 mV, VI=V½−ΔVmode/2, and VII=V½Vmode/2 for the HCN channel. B, as in A, but with a mode shift of 60 mV. Mode shift rate κ= 10 s−1. C, interpeak-interval measured as mean value for a period of about 16 s (thus, about 80 action potentials) after an equilibrium period of 10 action potentials. The interpeak interval variability was calculated as the r.m.s. deviation from the mean value. Continuous arrows mark the HCN channels at room temperature (Table 1). Dashed arrows mark the estimated positions of the HCN channels at 37°C, based on Q10= 3. D, the cAMP versus frequency dependence for SA node cells with four different HCN channels: (1) no HCN channels (dashed line); (2) a slow HCN channel (k = 1 s−1) without a mode shift (○, 30 mV Hz−1); (3) a faster HCN channel (k = 20 s−1) with a mode shift (ΔVmode= 60 mV, κ= 10 s−1; ○, 18 mV Hz−1); and (4) a fast HCN channel (k = 10 s−1) with a reduced mode shift (ΔVmode= 30 mV, κ= 10 s−1; □, 12 mV Hz−1).
Figure 9
Figure 9. Comparison of ionic currents during rhythmic and arrhythmic firing
A, simulation as in Fig. 8B, last second of 5 s simulation. B, simulation as in Fig. 8A, last second of 5 s simulation. C, overlay of simulation in A (continuous line) and B (dashed line). Top, membrane voltage; middle, ionic current from HERG (green); L-type Ca2+ (red), and HCN (blue) channels. Bottom, total HCN channel open probability (black), mode I open probability (red), mode II open probability (blue).

References

    1. Altomare C, Bucchi A, Camatini E, Baruscotti M, Viscomi C, Moroni A, DiFrancesco D. Integrated allosteric model of voltage gating of HCN channels. J Gen Physiol. 2001;117:519–532. - PMC - PubMed
    1. Altomare C, Terragni B, Brioschi C, Milanesi R, Pagliuca C, Viscomi C, Moroni A, Baruscotti M, DiFrancesco D. Heteromeric HCN1-HCN4 channels: a comparison with native pacemaker channels from the rabbit sinoatrial node. J Physiol. 2003;549:347–359. - PMC - PubMed
    1. Azene EM, Xue T, Marban E, Tomaselli GF, Li RA. Non-equilibrium behavior of HCN channels: insights into the role of HCN channels in native and engineered pacemakers. Cardiovasc Res. 2005;67:263–273. - PubMed
    1. Baruscotti M, Bucchi A, Difrancesco D. Physiology and pharmacology of the cardiac pacemaker (‘funny’) current. Pharmacol Ther. 2005;107:59–79. - PubMed
    1. Chen J, Mitcheson JS, Lin M, Sanguinetti MC. Functional roles of charged residues in the putative voltage sensor of the HCN2 pacemaker channel. J Biol Chem. 2000;275:36465–36471. - PubMed

Publication types

MeSH terms

LinkOut - more resources