. 2006 Jun 27;103(26):9970-5.
doi: 10.1073/pnas.0603912103. Epub 2006 Jun 15.

A Tlr7 translocation accelerates systemic autoimmunity in murine lupus

Affiliations

A Tlr7 translocation accelerates systemic autoimmunity in murine lupus

Srividya Subramanian et al. Proc Natl Acad Sci U S A. .

Abstract

The y-linked autoimmune accelerating (yaa) locus is a potent autoimmune disease allele. Transcription profiling of yaa-bearing B cells revealed the overexpression of a cluster of X-linked genes that included Tlr7. FISH analysis demonstrated the translocation of this segment onto the yaa chromosome. The resulting overexpression of Tlr7 increased in vitro responses to Toll-like receptor (TLR) 7 signaling in all yaa-bearing males. B6.yaa mice are not overtly autoimmune, but the addition of Sle1, which contains the autoimmune-predisposing Slam/Cd2 haplotype, causes the development of fatal lupus with numerous immunological aberrations. B6.Sle1yaa CD4 T cells develop the molecular signature for T(FH) cells and also show expression changes in numerous cytokines and chemokines. Disease development and all component autoimmune phenotypes were inhibited by Sles1, a potent suppressor locus. Sles1 had no effect on yaa-enhanced TLR7 signaling in vitro, and these data place Sles1 downstream from the lesion in innate immune responses mediated by TLR7, suggesting that Sles1 modulates the activation of adaptive immunity in response to innate immune signaling.


Conflict of interest statement

Conflict of interest statement: No conflicts declared.

Figures
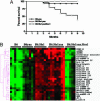
Fig. 1.
Fig. 1.
Genetic interactions among yaa, Sle1, and Sles1 modulate systemic autoimmunity. (A) Cohorts of male mice of the various yaa strains indicated were aged to 9 months to assess for spontaneous mortality (n = 15–23). (B) Sera were obtained from 4- to 6-month-old mice and assayed for the production IgG autoAbs of different specificities by using protein antigen arrays (24).
Fig. 2.
Fig. 2.
yaa contains a translocation of the X-linked Tlr7 gene. (A) Expression-level fold changes of the indicated X chromosome genes in B cells from 4- to 6-month-old mice of the different yaa strains relative to B6 controls, as determined by using Illumina BeadChip arrays (Upper). (Lower) Positions of the changed genes (bold) on the F5 band of mouse chromosome X according to www.ensembl.org. (B) Quantitative real-time PCR analyses of Tlr7 expression in purified B cells from different strains, confirming up-regulation in Tlr7 expression in yaa-bearing mice relative to B6. Error bars represent SEM. (C) Two-color FISH analyses were performed by using FITC-labeled RP23-92P6 BAC DNA (green) and Spectrum Orange-labeled RP24-208N6 BAC DNA (pink). Hybridization was done to metaphase chromosome spreads of splenic lymphocyte cultures from 7-week-old B6 and B6.yaa mice. Hybridization of respective probes is indicated: arrows, RP23-92P6 (green); arrowheads, RP24-208N6 (pink).
Fig. 3.
Fig. 3.
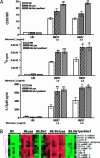
Functional changes associated with the Tlr7 translocation in yaa. (A) Sterile splenocyte suspensions from 6- to 8-week-old mice were plated in quadruplicate at 0.5 × 10⁶ cells per ml in complete RPMI medium 1640 with varying concentrations of the synthetic TLR7 agonist R837 (Imiquimod). Duplicate plates were set up, and cells were cultured at 37°C for 24 and 48 h. Either plates were pulsed with [3H]thymidine for the last 9 h and [3H]thymidine incorporation was measured by β-scintillation counting to assay for cell proliferation, or cells and supernatants were collected for flow-cytometric and ELISA analyses. In all bar charts error bars represent SEM (n = 3–6). ∗, P < 0.05; ∗∗, P < 0.01; ∗∗∗, P < 0.001 (versus B6 by ANOVA). (B) Sera obtained from 4- to 6-month-old mice were assayed by using protein antigen arrays and autoAbs specific for RNA-containing antigens examined using cluster analyses (24). Color coding of individual samples: black, mean of all samples; increasing green, increasingly below mean; increasing red, increasingly above mean.
Fig. 4.
Fig. 4.
TFH cell signature and cytokine dysregulations observed in B6.Sle1yaa T cells. (A and B) Heat map of gene-expression profiles of different cytokines, chemokines, and their receptors (A) and TFH cell genes (B) in sorted CD4 cells from 4- to 6-month-old mice, as determined by using Illumina BeadChip arrays. (C–E) ICOS (C), PD1 (D), and CXCR5 (E) expression on splenic CD4 subpopulations from the mice at 4–6 months. (Left) Representative histograms of ICOS, PD1, and CXCR5 expression on CD4+ spleen cells. Light gray, B6; blue, B6.yaa; dark gray, B6.Sle1yaa; brown, B6.Sle1yaaSles1. (Right) Cumulative ICOS, PD1, and CXCR5 expression on different CD62L versus CD44 splenic CD4 subpopulations cells at 4–6 months (n = 8 per genotype). Error bars represent SEM. ∗, P < 0.05; ∗∗, P < 0.01; ∗∗∗, P < 0.001 (versus B6 by ANOVA).

References

    1. Wakeland E. K., Liu K., Graham R. R., Behrens T. W. Immunity. 2001;15:397–408. - PubMed
    1. Wandstrat A. E., Wakeland E. K. Nat. Immunol. 2001;2:802–809. - PubMed
    1. Hudgins C. C., Steinberg R. T., Klinman D. M., Reeves M. J., Steinberg A. D. J. Immunol. 1985;134:3849–3854. - PubMed
    1. Liu K., Liang C., Liang Z., Tus K., Wakeland E. K. J. Immunol. 2005;174:1630–1637. - PubMed
    1. Mohan C., Alas E., Morel L., Yang P., Wakeland E. K. J. Clin. Invest. 1998;101:1362–1372. - PMC - PubMed

Publication types

Substances