. 2006 Jul 12;25(13):2966-77.
doi: 10.1038/sj.emboj.7601184. Epub 2006 Jun 15.

Regulation of mitochondrial morphology through proteolytic cleavage of OPA1

Affiliations

Regulation of mitochondrial morphology through proteolytic cleavage of OPA1

Naotada Ishihara et al. EMBO J. .

Abstract

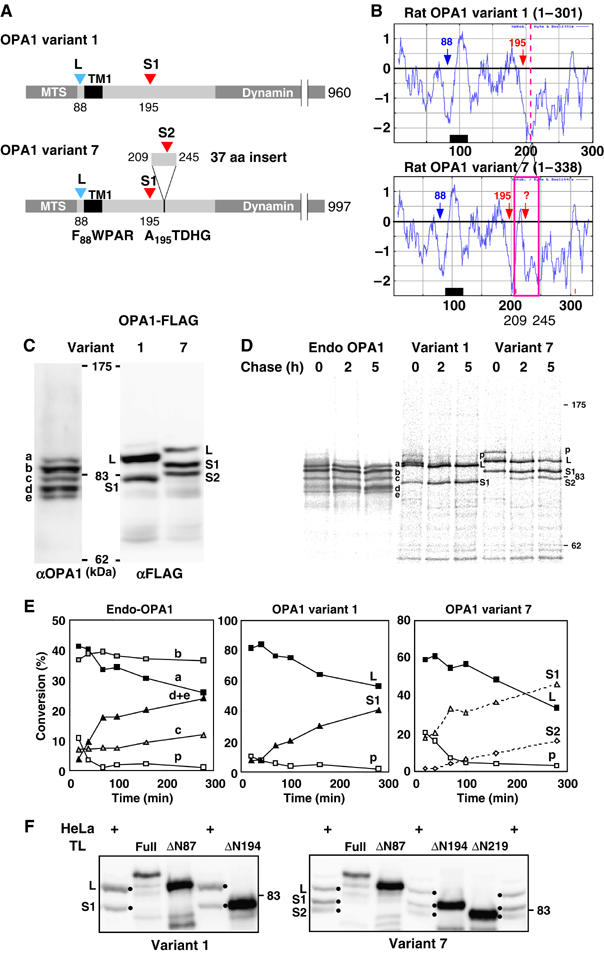
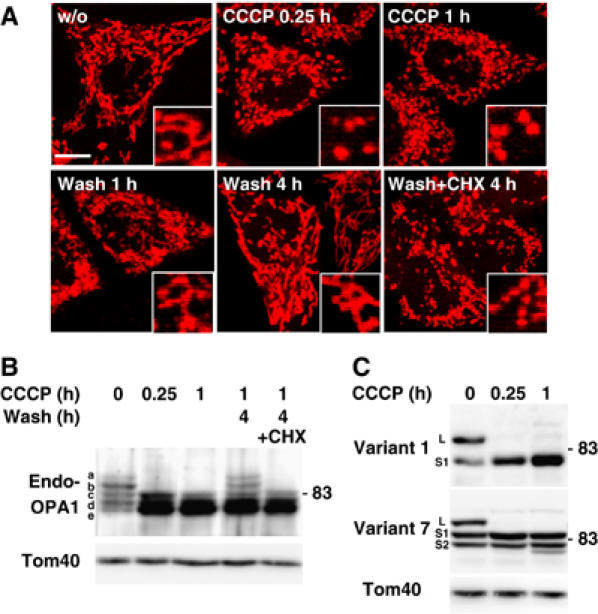
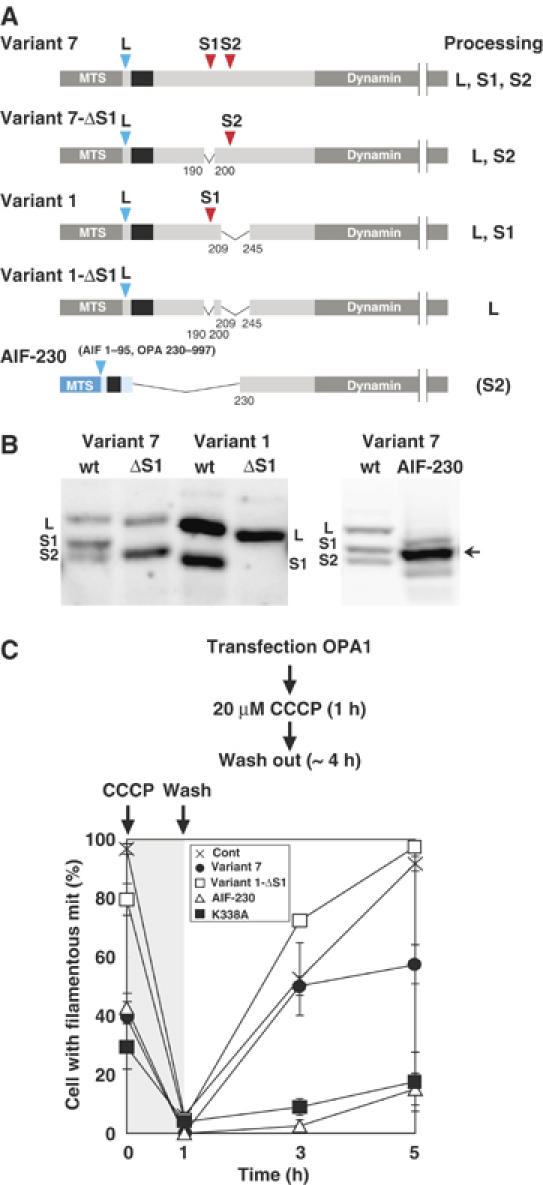
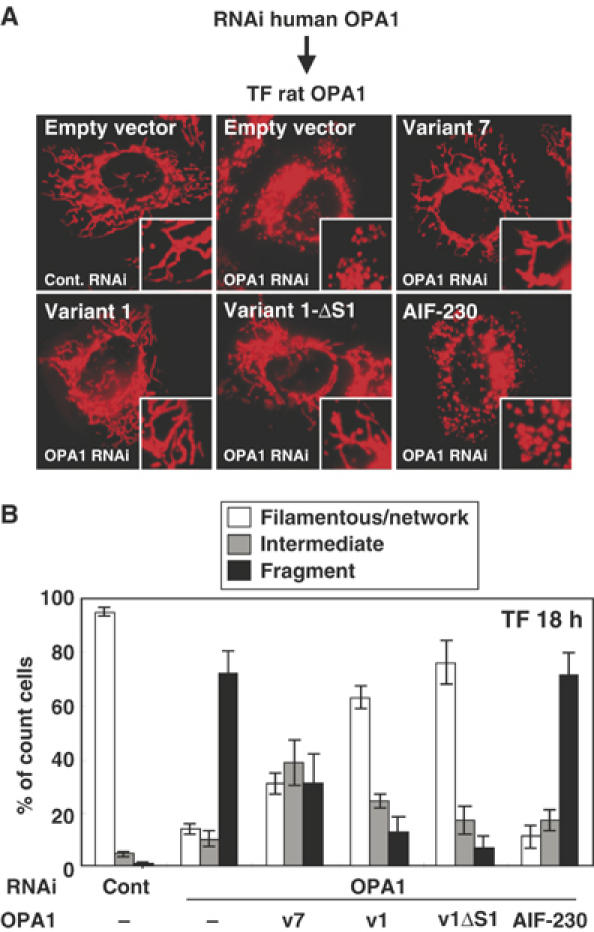
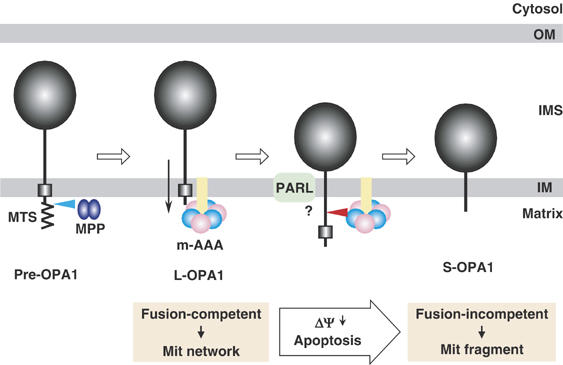
The dynamin-like GTPase OPA1, a causal gene product of human dominant optic atrophy, functions in mitochondrial fusion and inner membrane remodeling. It has several splice variants and even a single variant is found as several processed forms, although their functional significance is unknown. In yeast, mitochondrial rhomboid protease regulates mitochondrial function and morphology through proteolytic cleavage of Mgm1, the yeast homolog of OPA1. We demonstrate that OPA1 variants are synthesized with a bipartite-type mitochondrial targeting sequence. During import, the matrix-targeting signal is removed and processed forms (L-isoforms) are anchored to the inner membrane in type I topology. L-isoforms undergo further processing in the matrix to produce S-isoforms. Knockdown of OPA1 induced mitochondrial fragmentation, whose network morphology was recovered by expression of L-isoform but not S-isoform, indicating that only L-isoform is fusion-competent. Dissipation of membrane potential, expression of m-AAA protease paraplegin, or induction of apoptosis stimulated this processing along with the mitochondrial fragmentation. Thus, mammalian mitochondrial function and morphology is regulated through processing of OPA1 in a DeltaPsi-dependent manner.


Figures

Figure 1
Figure 1
Processing of OPA1 splice variants. (A) Schematic representation of rat OPA1 variants 1 and 7, and their processing sites. Processing sites are indicated by arrowheads, and numbers represent the amino-acid residues of the rat OPA1 precursor. The N-terminal amino-acid residues of L-OPA1 and S1-OPA1 are shown. (B) Hydrophobicity profiles of the N-terminal domain of two OPA1 variants were analyzed by Kite and Doolittle program (window 15). (C) Endogenously expressed OPA1 and exogenously expressed C-terminal FLAG-tagged OPA1 variants in HeLa cells were analyzed by immunoblotting using anti-OPA1 or anti-FLAG antibodies. (D, E) Processing of OPA1 proteins as analyzed by pulse-chase experiments. HeLa cells expressing endogenous OPA1 or exogenous OPA1 variants 1 or 7 were labeled with 35S-Met/Cys mix for 30 min, then chased for the indicated time periods. The cell lysates were subjected to immunoprecipitation using anti-OPA1 (endo-OPA1) or anti-FLAG (variant 1 and variant 7) antibodies. The indicated band intensities were quantified. As bands d and e were electrophorased closely, they were quantified together. p: precursor. (F) The N-terminal deletion mutants of OPA1-FLAG (ΔN87, ΔN194, and ΔN219) synthesized in vitro by PURESYSTMEM and the total lysates of the cells expressing OPA1-FLAG variants were subjected to SDS–PAGE and analyzed by immunoblotting using anti-FLAG antibodies.
Figure 2
Figure 2
Processing of OPA1 after dissipation of membrane potential. (A) HeLa cells stained by MitoTracker were cultured in the presence of 20 μM CCCP for 0.25 or 1 h. After 1 h culture, CCCP was washed out and the cells were further cultured for 1 or 4 h with or without 1 mM cycloheximide (CHX). Images were obtained by confocal microscopy. Inset: magnified images. Scale bar: 10 μm. (B) HeLa cells were treated as in (A). Lysates obtained from these cells were subjected to immunoblotting using anti-OPA1 antibodies. (C) HeLa cells expressing OPA1-FLAG variants were cultured under the indicated conditions, and the cell lysates were subjected to immunoblotting using anti-FLAG antibodies.
Figure 3
Figure 3
Exogenous expression of processing-defect mutants of OPA1 and their effects on mitochondrial fusion reaction. (A) Schematic representation of OPA1 constructs and their process sites. See Figure 1A for details. (B) HeLa cells expressing the indicated constructs were analyzed by immunoblotting using anti-FLAG antibodies. (C) The indicated OPA1 constructs were exogenously expressed in HeLa cells and the cells were treated with CCCP for 1 h. After removal of CCCP, the cells were incubated for the indicated times. At least 100 cells were counted for the cells with filamentous network structures of mitochondria for three distinct fields. Note that ‘cell with filamentous mit' in this figure (ordinate) corresponds to ‘filamentous/network' plus ‘intermediate' in Supplementary Figure S4B.
Figure 4
Figure 4
Complementation of mitochondrial morphology by L-OPA1 in OPA1-RNAi cells. (A) HeLa cells were transfected with the siRNA for GFP (cont.) or for human OPA1 three times with 48 h intervals. Then the indicated constructs were transfected and cultured for 18 h. The cells were stained with MitoTracker. (B) HeLa cells with filamentous-network, intermediate, or completely fragmented mitochondrial structures in (A) were counted. At least 100 cells were counted from three different optical fields.
Figure 5
Figure 5
Increment of hydrophobicity of TM1 does not inhibit OPA1 processing. (A) Schematic representation of OPA1 constructs mutated in TM1. Average hydrophobicity of mutated TM1 was also shown. (B, C) HeLa cells expressing the indicated constructs were analyzed by immunoblottiong using anti-FLAG antibodies. (D) The indicated constructs were transfected to HeLa cells, and cultured with or without CCCP for 1 h. Isolated mitochondria were converted to mitoplasts in hypotonic buffer, then treated with sodium carbonate at pH 10.5, or pH 11.5. The membrane pellets (P) and soluble fractions (S) were subjected to immunoblotting using antibodies against FLAG or the indicated proteins.
Figure 6
Figure 6
Inhibition of CCCP-induced processing of OPA1 variants by o-phenanthroline. (A) HeLa cells expressing FLAG-tagged OPA1 variant 1 were cultured in the presence of 0.5 mM 1,10-phenanthroline (o-phe) for 2 or 6 h, then 20 μM CCCP was added. After 1 h culture, cell lysates were prepared and subjected to immunoblotting using anti-FLAG antibodies. p: precursor. (B) Isolated mitochondria from HeLa cells expressing FLAG-tagged OPA1 variant 1 were incubated with or without 20 μM CCCP in the presence of 1 mM o-phe at 30°C for 60 min. The mitochondria were subjected to immunoblotting using anti-FLAG antibodies. (C) The isolated mitochondria from HeLa cells expressing the OPA1-FLAG constructs were incubated with or without 1 mM o-phe or 1 mM TPCK at 30°C for the indicated time periods. The mitochondria were subjected to immunoblotting using anti-FLAG antibodies.
Figure 7
Figure 7
Effect of m-AAA proteases on OPA1 processing and mitochondrial morphology. (A) HA-tagged paraplegin (Para), AFG3L2 (AFG), or paraplegin mutant on metal-binding motif (E575Q) was cotransfected with FLAG-tagged OPA1-variant 1 into HeLa cells. The mitochondrial fractions were subjected to immunoblotting using anti-FLAG or anti-HA antibodies. For cotransfection, OPA1-expression plasmid (0.5 μg) was mixed with 0.5 μg (+) or 1.5 μg (+++) of the protease-expression plasmids. Total amounts of DNA were adjusted to 2.0 μg with empty vector. The upper bands detected in paraplegin-HA-expressing cells seemed to be the precursor. (B, C) Paraplegin (Para) or PARL were cotransfected with OPA1 variants into HeLa cells and analyzed as in (A). (D) OPA1-FLAG (variant 1) was transfected with or without paraplegin-HA. Isolated mitochondria were preincubated with 2 mM o-phe at 30°C (pre-inc.), then solubilized in 1% digitonin and immunoprecipitated with anti-HA IgGs. The precipitants were washed with 150 or 500 mM (NaCl ‘+') NaCl. They were analyzed by immunoblotting using anti-HA or anti-FLAG IgGs. (E) HeLa cells expressing the indicated constructs were labeled with MitoTracker and subjected to immunofluorescence microscopy. Scale bar: 10 μm. (F) HeLa cells with filamentous-network, intermediate, or completely fragmented mitochondrial structures in (E) were counted. More than 100 cells were counted for three different optical fields.
Figure 8
Figure 8
Knockdown of paraplegin and PARL by RNAi in HeLa cells. (A) HeLa cells were transfected with the siRNA duplex for GFP (control) or the indicated proteases three times. An aliquot of the cells was subjected to immunoblot analysis using anti-OPA1 antibodies (for endogenous OPA1). The other aliquots were transfected with OPA1-variant 1-FLAG, paraplegin-HA, or PARL-FLAG, then analyzed by immunoblotting using anti-FLAG (for OPA1 variant 1 and PARL) or anti-HA antibodies (for paraplegin). (B) The amount of mRNAs for paraplegin, PARL, Afg3L2, and OPA1 were examined by RT–PCR using 100- (+) or 10-fold (++) diluted templates. In all, 200–400 bp fragments were amplified. (C, D) The RNAi cells in (A) were labeled with 35S-Met/Cys mix for 30 min, then chased for the indicated time periods (h). The cell lysates were subjected to immunoprecipitation using anti-FLAG (for OPA1 variant 1; C) or anti-OPA1 (for endogenous OPA1; D). The immunoprecipitates were analyzed by SDS–PAGE and subsequent digital autoradiography as in Figure 1D and E. *P and **P<0.05 in (C). *P and **P<0.05 in (D). (E) HeLa cells subjected to RNAi as above were stained with MitoTracker and analyzed by fluorescence microscopy. Scale bar: 10 μm. (F) The number of cells with highly elongated and enriched mitochondria, filamentous-network, intermediate, or completely fragmented mitochondrial structures in (E) were counted and are shown as a percentage. More than 100 cells were counted for three different optical fields.
Figure 9
Figure 9
Model of proteolytic processing of OPA1. See Discussion for details.

References

    1. Alexander C, Votruba M, Pesch UE, Thiselton DL, Mayer S, Moore A, Rodriguez M, Kellner U, Leo-Kottler B, Auburger G, Bhattacharya SS, Wissinger B (2000) OPA1, encoding a dynamin-related GTPase, is mutated in autosomal dominant optic atrophy linked to chromosome 3q28. Nat Genet 26: 211–215 - PubMed
    1. Arlt H, Tauer R, Feldmann H, Neupert W, Langer T (1996) The YTA10-12 complex, an AAA protease with chaperone-like activity in the inner membrane of mitochondria. Cell 85: 875–885 - PubMed
    1. Atorino L, Silvestri L, Koppen M, Cassina L, Ballabio A, Marconi R, Langer T, Casari G (2003) Loss of m-AAA protease in mitochondria causes complex I deficiency and increased sensitivity to oxidative stress in hereditary spastic paraplegia. J Cell Biol 163: 777–787 - PMC - PubMed
    1. Casari G, De Fusco M, Ciarmatori S, Zeviani M, Mora M, Fernandez P, De Michele G, Filla A, Cocozza S, Marconi R, Durr A, Fontaine B, Ballabio A (1998) Spastic paraplegia and OXPHOS impairment caused by mutations in paraplegin, a nuclear-encoded mitochondrial metalloprotease. Cell 93: 973–983 - PubMed
    1. Chen H, Chan DC (2004) Mitochondrial dynamics in mammals. Curr Top Dev Biol 59: 119–144 - PubMed

Publication types

MeSH terms